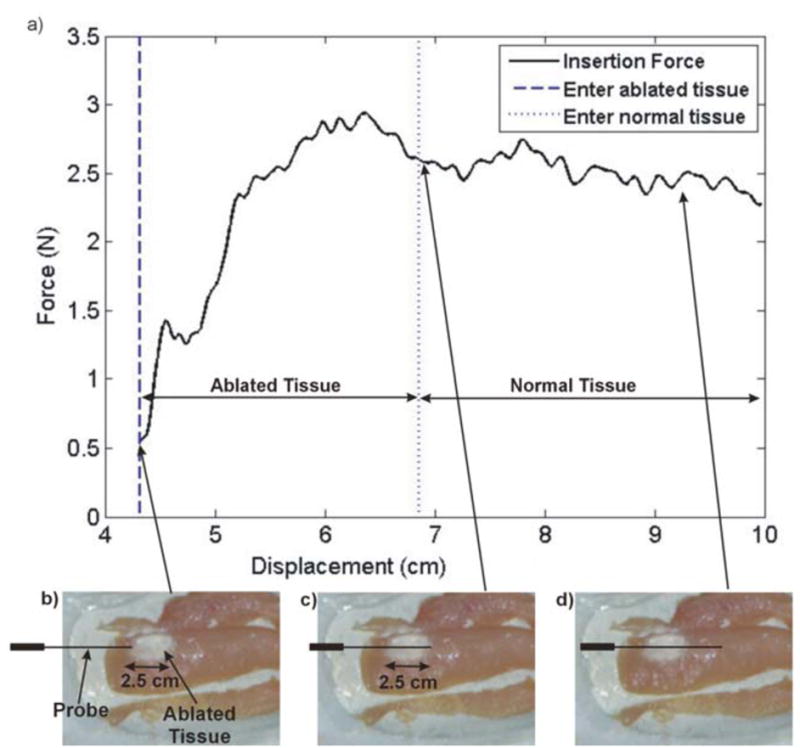
Fig. 10.

(a) Force vs. Displacement profile during needle insertion after RFA, through 2.5 cm region of ablated area and approximately 2.5 cm of normal tissue. Ablated tissue is shown depicting probe traversal as the probe tip (b) enters the ablated region, (c) exits the ablated region, and (d) travels through normal tissue.
