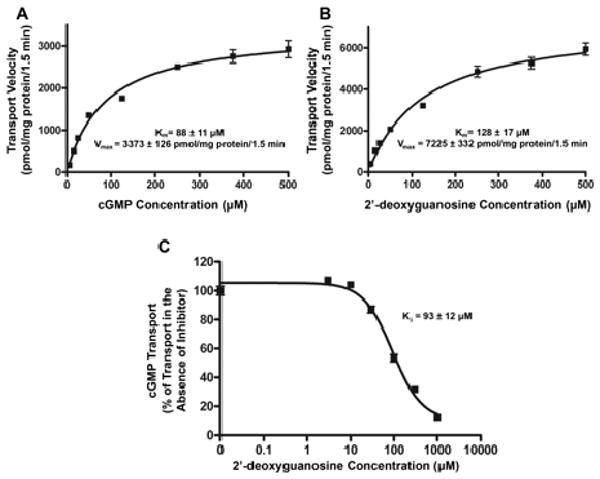
Fig. 3.

Concentration-dependent transport of cGMP (A) and 2′-deoxyguanosine (B) by hOAT2 and 2′-deoxyguanosine inhibition of hOAT2-mediated cGMP transport (C). Empty vector-stably transfected and hOAT2-stably transfected HEK293 cells were incubated for 1.5 min with varying concentrations (5, 15, 25, 50, 125, 250, 375, and 500 μM) of cGMP (A), or 2′-deoxyguanosine (B). 2′-Deoxyguanosine transport rate was measured in the presence of 10 μM NBMPR to inhibit background uptake. hOAT2-specific uptake was determined by subtracting uptake in empty vector-transfected cells from that in hOAT2-transfected cells after correcting for total protein. Kinetic parameters were estimated by fitting hOAT2-specific uptake rates to a Michaelis-Menten equation by nonlinear regression. Data are shown as the mean ± S.D. from triplicate samples in a representative experiment. C, empty vector-transfected and hOAT2-transfected HEK293 cells were incubated for 1.5 min with 2 μM radiolabeled cGMP and varying concentrations (0, 3, 30, 100, 300, and 1000 μM) of 2′-deoxyguanosine. NBMPR (10 μM) was added to all of the 2′-deoxyguanosine reaction mixes to inhibit ENT1 transport. hOAT2-specific uptake was determined by subtracting uptake by EV-transfected cells from that in hOAT2-transfected cells after correcting for total protein. IC50 and Ki parameters were estimated by nonlinear regression. Uptake results shown in the graphs are from a representative experiment. Each point represents the mean ± S.D. of triplicate samples.
