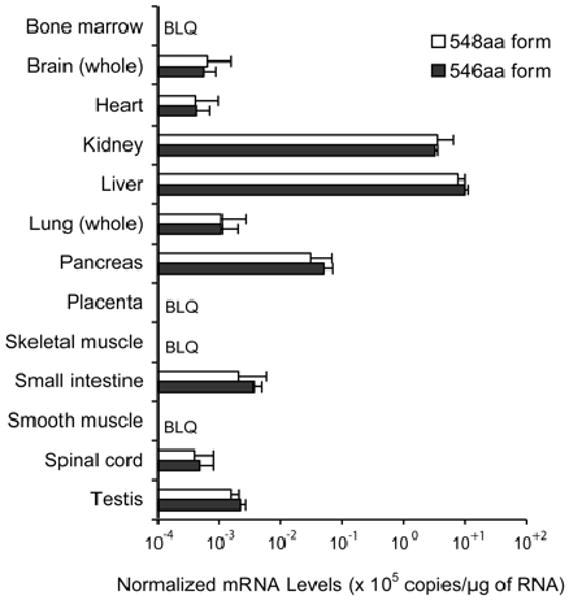
Fig. 6.

Tissue distribution of alternative splice forms of hOAT2. mRNA expression of hOAT2-546aa (solid bars) and hOAT2-548aa (open bars) was determined by real-time PCR using TaqMan primers and probes specific to each isoform. Sensitivity of each assay for its target sequence was >10,000-fold greater than for the alternative target. Expression level of each isoform was normalized to GAPDH expression. Each bar represents the mean ± S.D. from quadruplicate assays of two independent cDNA sources. BLQ, below the limit of quantification.
