
Figure 3. ST6GALNAC5 expression and activity in brain metastasis from breast cancer.
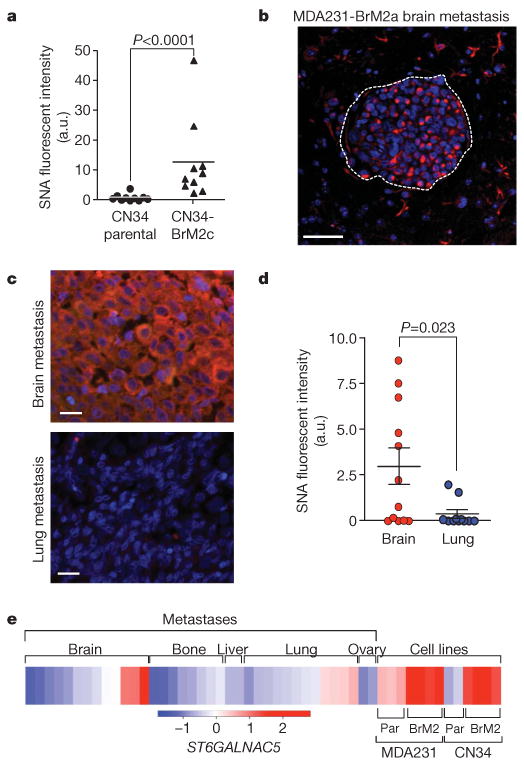
a, Quantification of SNA staining in mammary fat pad tumours formed by parental CN34 or CN34-BrM2c cells in mice. a.u., arbitrary units. b, SNA staining of a mouse brain metastasis after intracardiac inoculation of MDA231-BrM2a cells. Scale bar, 50 μm c, SNA staining of representative human brain and lung metastases samples from the same breast cancer patient. Scale bars, 20μm. d, Distribution of SNA staining intensity, quantified by Metamorph analysis, in 12 brain and 11 lung metastases resected from breast cancer patients. P values (a, d) were determined by Mann–Whitney one-tailed test. e, Heat map showing the relative ST6GALNAC5 expression levels in a panel of 13 brain, 8 bone, 3 liver, 12 lung and 2 ovary human metastases from breast cancer patients. Included for comparison are the parental (par) and brain metastatic derivatives from MDA231 and CN34 cells. Data are on the basis of Affymetrix probe intensity.