
Figure 7.
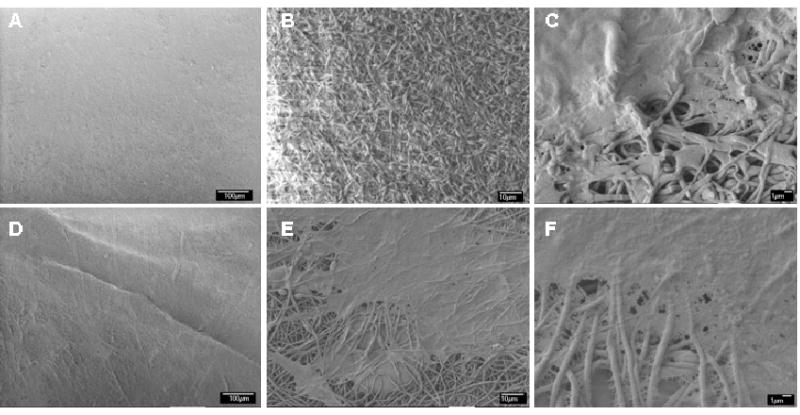
SEM images of human aortc endothelial cells (A-C) and human coronary smooth muscle cells (D-F) grown on electrospun silk mats after 7 days in culture at (A,D) 500, (B,E) 1000, and (E,F) 3,500 magnification. Scale bars are: A&D: 100 um; B&E: 10 μm; C&F: 1 μm)