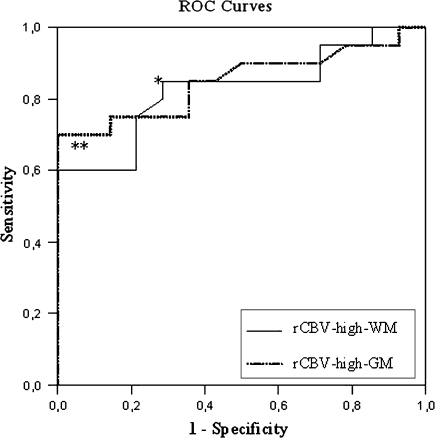
Fig. 4.
ROC curves. The figure displays the ROC curves for rCBV-high-WM (straight line) and -GM (dotted line), with areas under curves of 0.827 and 0.839, respectively. The most discriminative cutoff point for rCBV-high-WM (*) is 2.01 with a sensitivity of 85.0% and specificity of 71.4%. For rCBV-high-GM, this point (**) corresponds to a cutoff of 1.85 with a sensitivity of 70.0% and specificity of 100%

