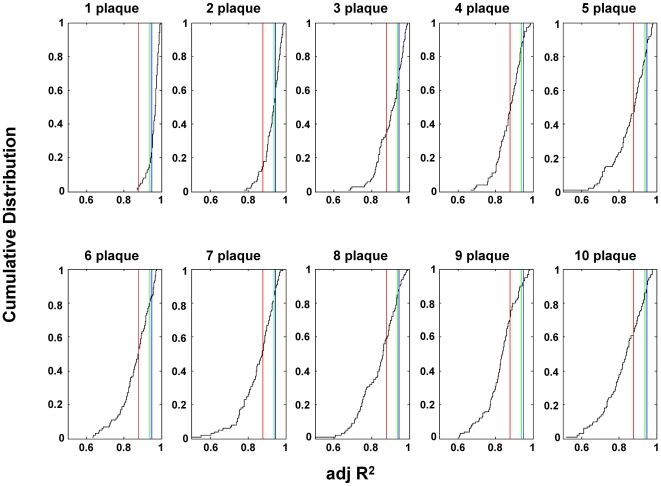
Figure 7. Adjusted R2 values for simulations of plaque.
A simulation was performed where infectious plaques were initiated randomly, allowed to grow exponentially and randomly sampled 25 times (see Text S1 and Figure S2). This data was then plotted as a CDF and the adjusted R2 estimated for the best fit straight line to the data. This process was repeated 100 times for each of the plaque numbers indicated and the resulting R2 values plotted as a CDF. The red line indicates the lowest (0.88), the green line the 7th lowest (0.94) and the blue line the median R2 for our 8 subjects (see Table 2).

