
Figure 4.
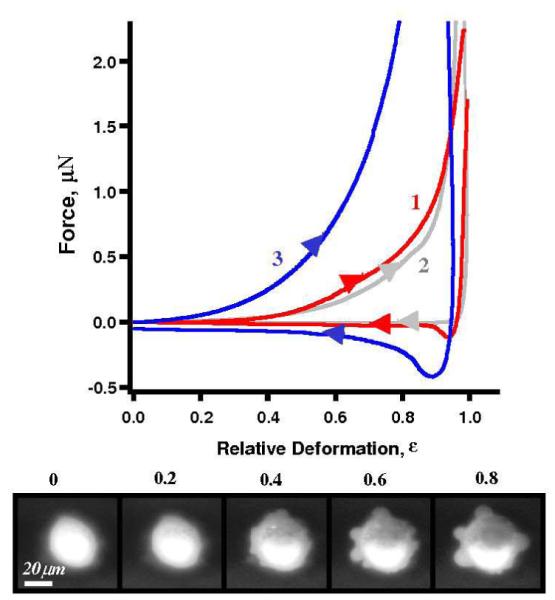
Typical deformation profiles for the investigation of cell tracing dyes on MLC-SV40 cells: an unlabeled (control) cell (1, red), a DMSO treated cell (2, gray), and a cell labeled with 5 μM CFDA-SE (3, blue). The insert shows the loading portion of the profile at low deformations. Bottom row shows epifluorescent snapshots of a 5 μM CFDA-SE labeled MLC-SV40 cell taken during compression cycle (bottom view).