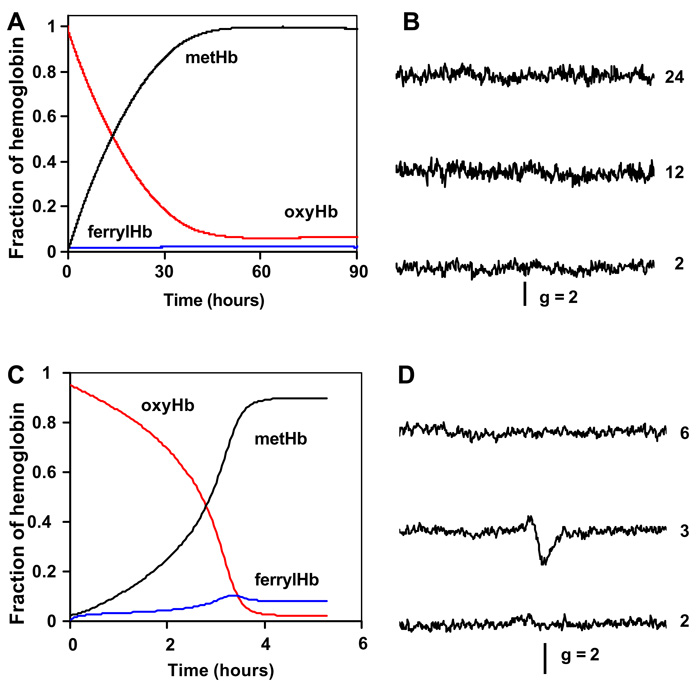
Fig. 3.
(A) Multilinear regression analysis applied to the spectral set from Fig. 1A using standard oxyHb, ferrylHb and metHb spectra. (B) EPR scans in g = 2 region of aliquots taken from reaction mixture of nitrite/oxyHb 2/1 at different time points indicated by numbers on the right (time given in hours) (C) Multilinear regression analysis applied to the spectral set from experiment with nitrite/Hb molar ratio of 10/1 (300 µM nitrite and 30 µM oxyHb) using standard oxyHb, ferrylHb and metHb spectra. (D) EPR scans in g = 2 region of aliquots taken from reaction mixture of nitrite/oxyHb 10/1 at different time points indicated by numbers on the right (time given in hours).

