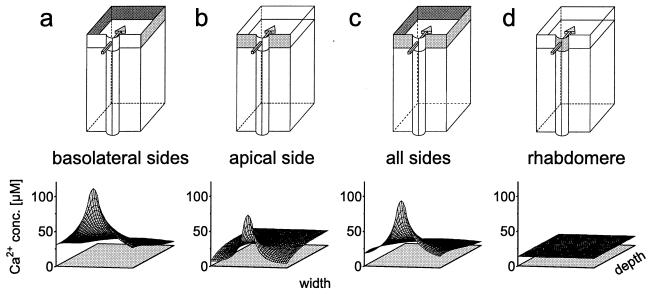
Figure 2.
Calculated distribution of Cai in a cross section of a square model cell. The continuous influx is assumed to occur at a 1.5-μm-wide region of one side (arrow in the diagrams). Extrusion is modeled at different regions of the plasma membrane, as indicated in the diagrams by the gray shading. (a) Ca2+ extrusion only at the basolateral sides. (b) Ca2+ extrusion only at the apical side, the Ca2+ influx region (rhabdomere) excluded. (c) Ca2+ extrusion at all sides, but the Ca2+ influx region excluded. (d) Ca2+ extrusion only at the Ca2+ influx region. In a–c, the resulting distribution of Cai shows large gradients, but not in d.

