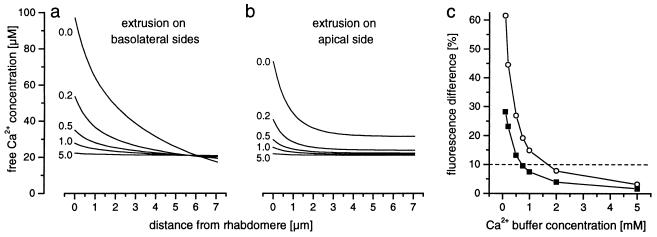
Figure 3.
The concentration of the Ca2+ buffer strongly influences the modeled distribution of the free Ca2+ concentration. (a and b) The free Ca2+ concentration profile along the symmetry line through the cell body, from the Ca2+ influx region to the opposite side of the cell body, is plotted. The extrusion was assumed to take place only at basolateral sides (a; as in Fig. 2a) or only at the apical side (b; as in Fig. 2b). Increasing the buffer concentration (indicated by the numbers, in millimolars) reduces the size of the predicted gradients. (c) The relative fluorescence intensity difference of a Ca2+ indicator with Kd = 20 μM between the Ca2+ influx region (x = 0 μm in a and b) and the opposite end of the cell body (x = 7.1 μm in a and b) is plotted as a function of the buffer concentration, when assuming extrusion on the basolateral sides (○) or on the apical side (▪). Below a buffer concentration of 0.75 mM, the fluorescence intensity between the two points differs by more than 10% (dashed line).

