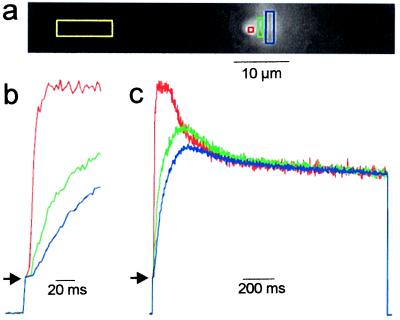
Figure 4.
The steady-state distribution of Cai in a cross section of a photoreceptor cell is homogeneous. (a) Raw intensity image (gray scale) of 100 successive images averaged during the steady state. The colored squares indicate the regions of interest quantitatively analyzed in b and c; red, rhabdomere; green, center of cell; blue, side of cell opposite the rhabdomere; yellow, background, outside the cell that was injected with the Ca2+ indicator. (b and c) Normalized fluorescence traces (the first value obtained after turning on the light was used for normalization; arrows). The normalized fluorescence rises sharply in the rhabdomere (red line) and displays a large transient. After the decay of the transient, the normalized fluorescence shows the same values, independent of location of the region of interest. The distribution of Cai during the steady state thus is homogeneous. The traces are averages of five experiments.

