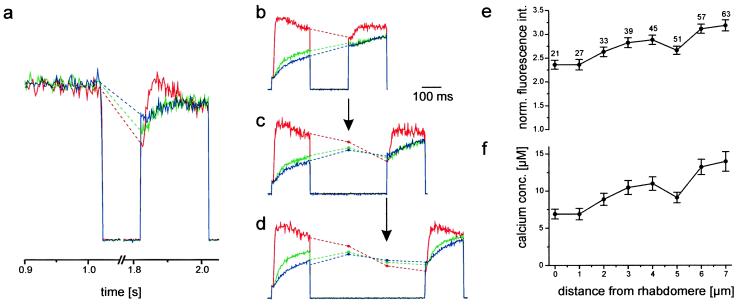
Figure 5.
Ca2+ extrusion is faster in the rhabdomere than in the rest of the cell. (a) After 1 s of light stimulation (of which the last 100 ms are shown), which allowed Cai to reach a homogeneous steady state (as in Fig. 4), the cell was dark adapted for 800 ms. After this dark period, the reduction of the Cai-induced fluorescence was stronger in the rhabdomere (red trace) than in other parts of the cell (green and blue traces). (b–d) A different cell was stimulated for 200 ms, and the light was then turned off for 200 ms (b), 400 ms (c), or 600 ms (d) and turned on again (for 200 ms) to probe the change of fluorescence, and hence Cai, during the dark period. Again, in the rhabdomere, Ca2+ declines much faster and to lower values than in the cell body. (e) The gradient of Cai at the onset of the second light stimulus in d plotted as normalized fluorescence intensity vs. distance from the rhabdomere. The error bars give the SEM obtained by averaging over the amount of pixels indicated by the numbers. (f) From the normalized fluorescence traces, the Cai values were calculated as described in ref. 9 by assuming Fmax = 6.3, Fmin = 1, and Kd = 20 μM (29, 30). The traces were averaged 10 (a), 5 (b), 2 (c), and 6 (d) times.

