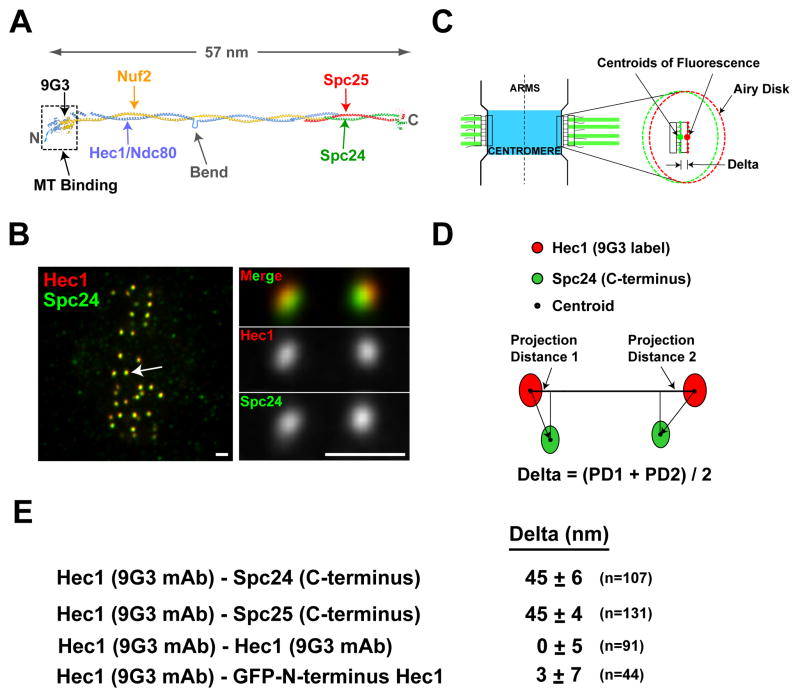
Figure 1. Delta Measurements for the Ndc80 Complex.
(A) Molecular structure of the tetrameric Ndc80 complex. (B) Images of metaphase HeLa cells fixed and stained for Hec1 9G3 (red) and anti-Spc24 (green). Scale bar = 1.1 μm. (C) Schematic of a pair of sister kinetochores at metaphase with one kinetochore expanded to show Airy disk images of 9G3 and anti-Spc24 labels and Delta, the distance between their centroids along the inner-outer kinetochore axis. (D) Method for calculation of Delta that eliminates, locally, errors from lateral chromatic aberration in microscope optics. (E) Average Delta measurements for different label pairs along the Ndc80 complex.

