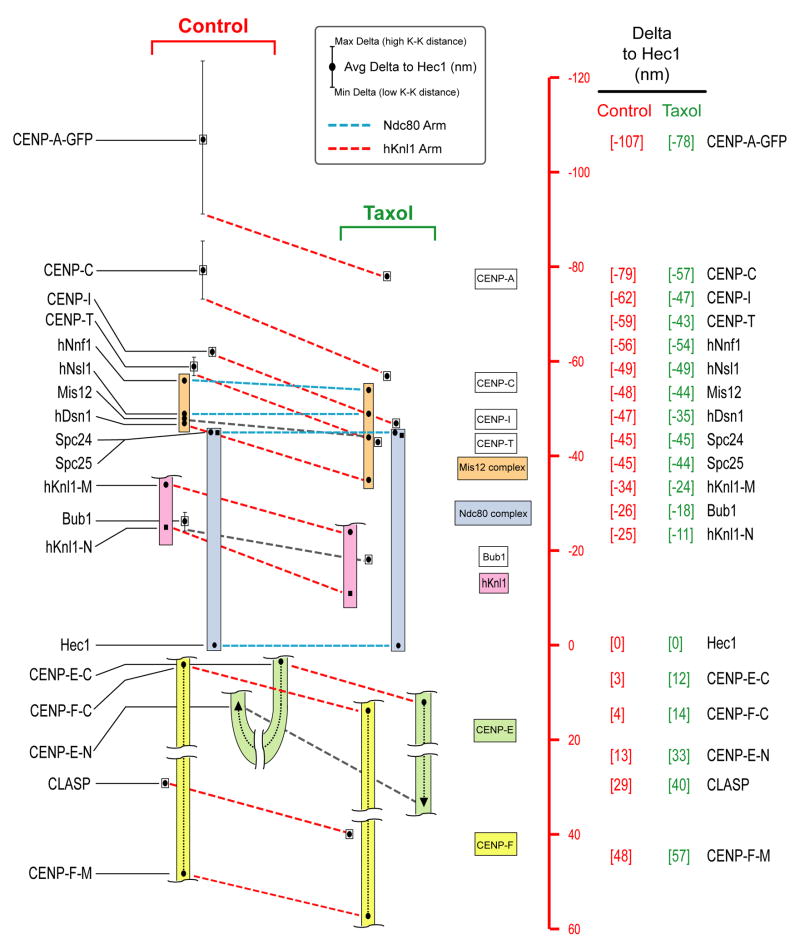
Figure 3. Summary of Delta Measurements in Control and Taxol-Treated HeLa Cells.
Summary of Delta measurements for 19 epitopes in 16 kinetochore proteins in control cells (left) and taxol-treated cells (right). Scale (red) on the far-right is set equal to zero at the position of the Hec1 9G3 centroid; positive values are outward (towards the spindle MTs) while negative values are inward (towards the centromeric chromatin). Color-coded boxes indicate complexes. Colored dotted lines indicate proposed “arms” of the structural kinetochore. Black dots indicate average Delta values corrected for tilt. Vertical lines indicate minimum and maximum Delta values measured during oscillations in centromere stretch – for most linkages that do not show significant compliance, the vertical lines do not extend beyond the symbol used to indicate the average.

