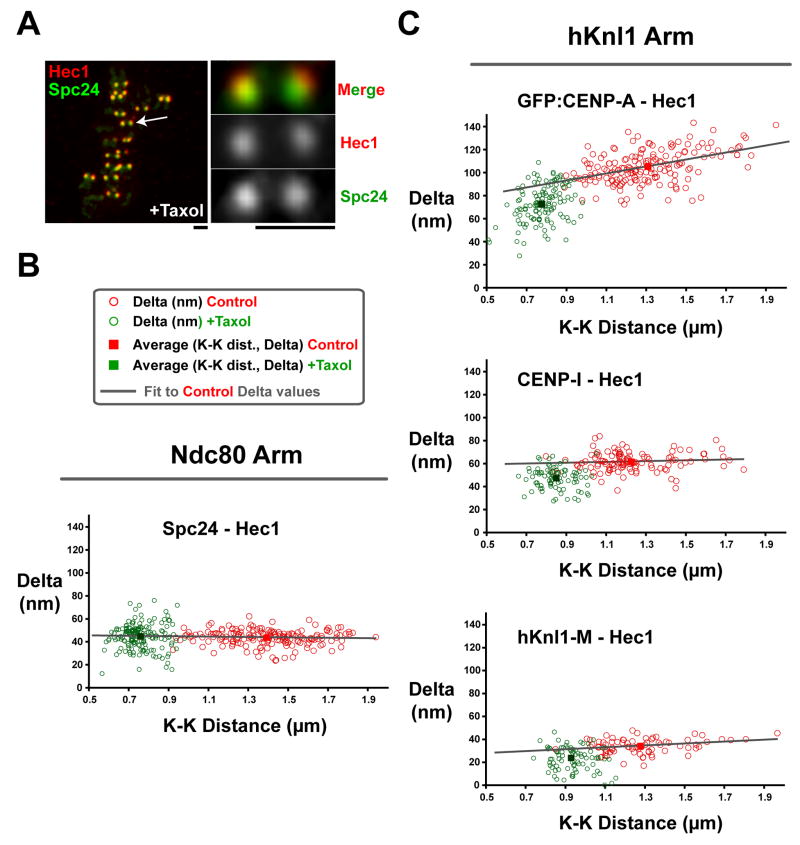
Figure 4. Changes in Kinetochore Architecture Associated with Taxol Treatment.
(A) Images of a metaphase HeLa cell treated with 10 μm taxol and then fixed and stained for Hec1 9G3 (red) and anti-Spc24 (green). Scale = 1.1 μm. (B) Graph of measured Delta value vs. K-K distance for the Hec1 and Spc24 labels in untreated (red) and taxol-treated (green) cells. (C) Graph of measured Delta value vs. K-K distance for the Hec1 label vs. GFP-CENP-A (top) and antibodies to CENP-I (middle), and hKnl1 (bottom) in untreated (red) and taxol-treated (green) cells. The whole dataset of Delta values uncorrected for tilt are shown; the average Deltas are within 1–2 nm of corrected values (Supp. Table 1).

