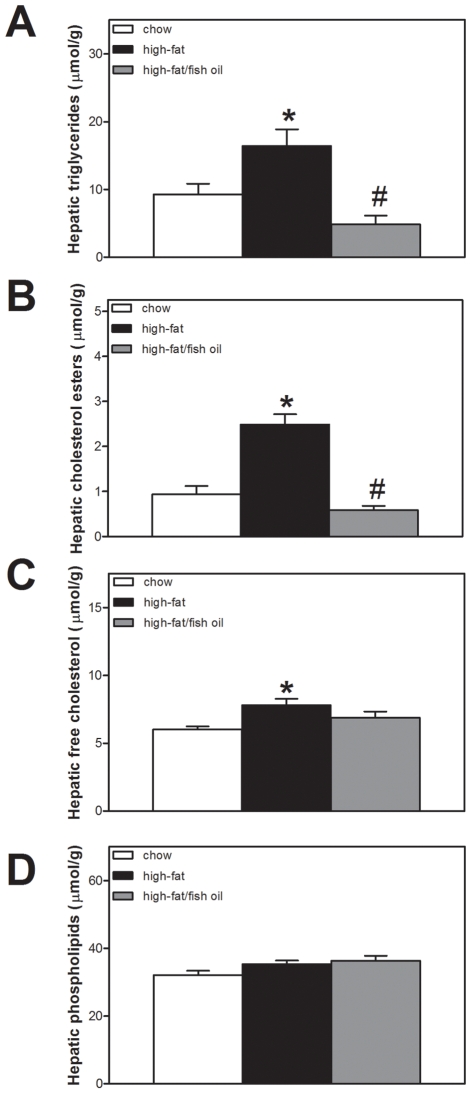
Figure 2. Hepatic lipid content.
A, Hepatic triglyceride content. B, Hepatic cholesterol ester content. C, Hepatic free cholesterol content. D, Hepatic phospholipid content. White bars represent chow diet; black bars represent high-fat diet and grey bars represent high-fat/fish oil diet. Values are given as means±SEM for n = 6/7; * p<0.05 high-fat vs. chow; # p<0.05 high-fat/fish oil vs. high-fat.

