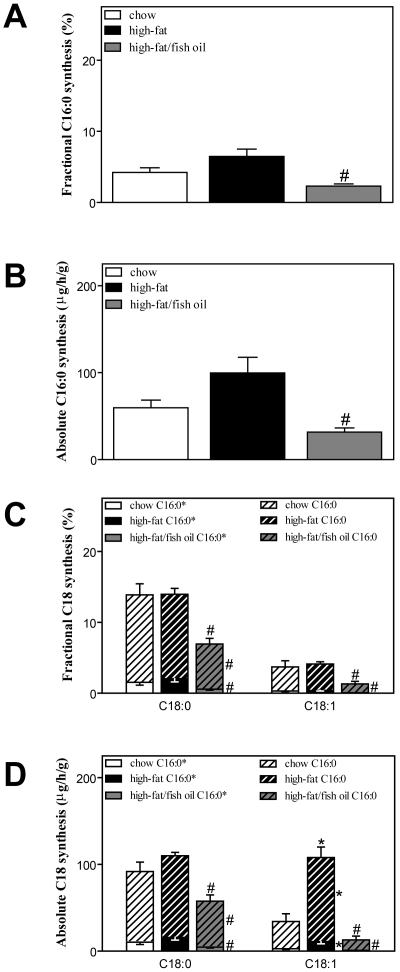
Figure 3. Hepatic fatty acid synthesis.
A, Fractional palmitate synthesis from de novo lipogenesis (C16:0*). B, Absolute palmitate synthesis from de novo lipogenesis (C16:0*). C, Fractional stearate (C18:0) and oleate (C18:1) synthesis from elongation of de novo synthesized (C16:0*) and pre-existing (C16:0) palmitate. D, Absolute stearate (C18:0) and oleate (C18:1) synthesis from elongation of de novo synthesized (C16:0*) and pre-existing (C16:0) palmitate. White bars represent chow diet, black bars represent high-fat diet and grey bars represent high-fat/fish oil diet. Plain bars represent synthesis from elongation of de novo synthesized palmitate and dashed bars represent synthesis from elongation of pre-existing palmitate. Absolute synthesis rates are expressed as micrograms per gram liver per hour. Values are given as means±SEM for n = 5–7; * p<0.05 high-fat vs. chow; # p<0.05 high-fat/fish oil vs. high-fat.

