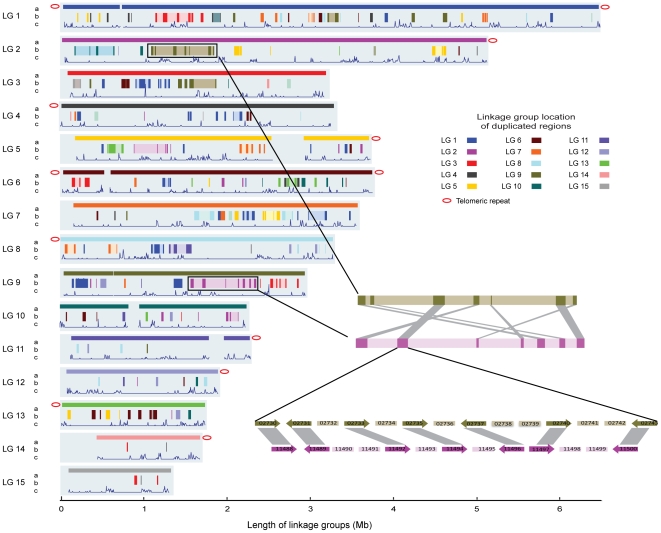
Figure 2. R. oryzae genomic structure showing duplicated regions retained after WGD and distribution of LTR transposable elements.
The length of the light blue background for each linkage group is defined by the optical map. For each chromosome, row a represents the genomic scaffolds positioned on the optical linkage groups. The red oval indicates linkage to telomeric repeat arrays. Row b displays the 256 duplicated regions capturing 648 gene pairs and spanning 12% of the genome. The shaded backgrounds around some duplicated regions illustrate the duplicated blocks by merging duplicated regions that are within 200 kb after discounting the transposon sequences. These extended duplicated blocks contain the same amount of the duplicates but span 23% of the genome. A pair of corresponding duplicated regions between linkage 2 and linkage 9 are shown in the zoomed images. The numbers in the gene boxes are gene IDs. Row c corresponds to the distribution of the LTR retroelements.

