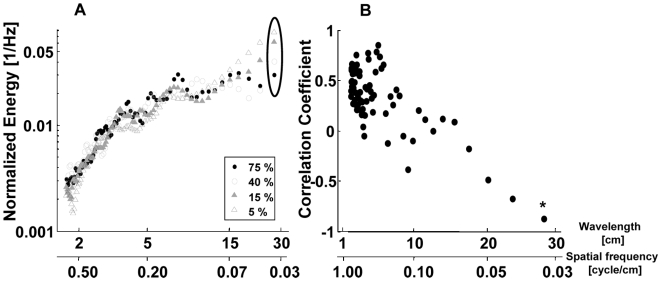
Figure 5. The effect of the leaf density on the echoes' spectra.
A) Mean normalized spectra of the envelopes of the echo trains of a Ficus plant with four different leaf densities (out of the eleven measured). Notice the shift of energy from the small scales to the large scales as leaf density decreases. Spectra were normalized to have a sum of one. B) Pearson correlation coefficient between leaf density and energy. Each point in the graph presents the correlation between 11 leaf densities and their corresponding energies for the scale given on the X axis. As an example, we marked the correlation between density and energy at a scale of 27 cm (depicted by an ellipse in A and an asterisk in B) that is almost perfectly negative linear.

