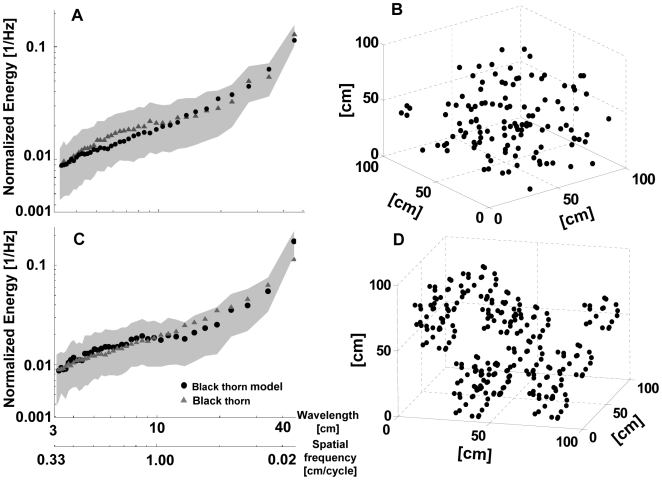
Figure 8. Modeling echo statistics.
A) Mean normalized power spectra of blackthorn and the best fitting uniform model for all scales (d1 = 16 cm). The shaded area depicts the standard deviation predicted by the model. B) A sample from the uniform 3D Poisson distribution of reflectors with a distance of d = 16 cm. C) Same as A, for the best fitting second-order model (d1 = 40 cm, d2 = 16 cm, r2 = 50 cm). D) A sample from the 3D distribution of reflectors created by the second-order model with the same parameters as in C.

