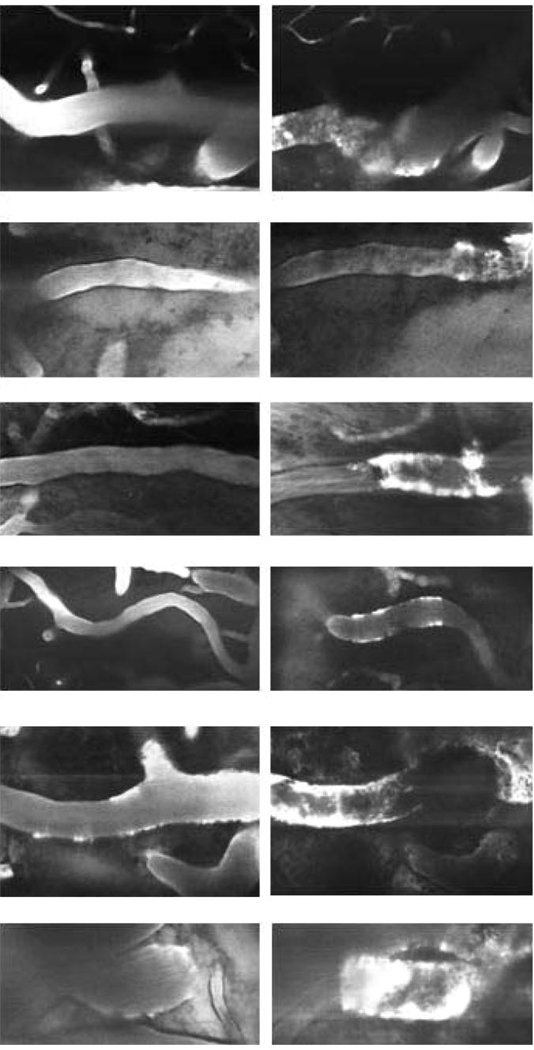
Figure 1.
Representative 30- to 50-µm cortical arterioles visualized by TPLSM after intravenous administration of FITC-dextran. Left column: appearance at baseline, before thrombosis. Right column: 30 minutes after thrombus-induction. Thrombosis is evident by irregular interruption of the dye column. The thrombosed vascular segments are variably dilated, and there is focal plasma extravasation into vessel walls, denoting vascular injury (20x objective).

