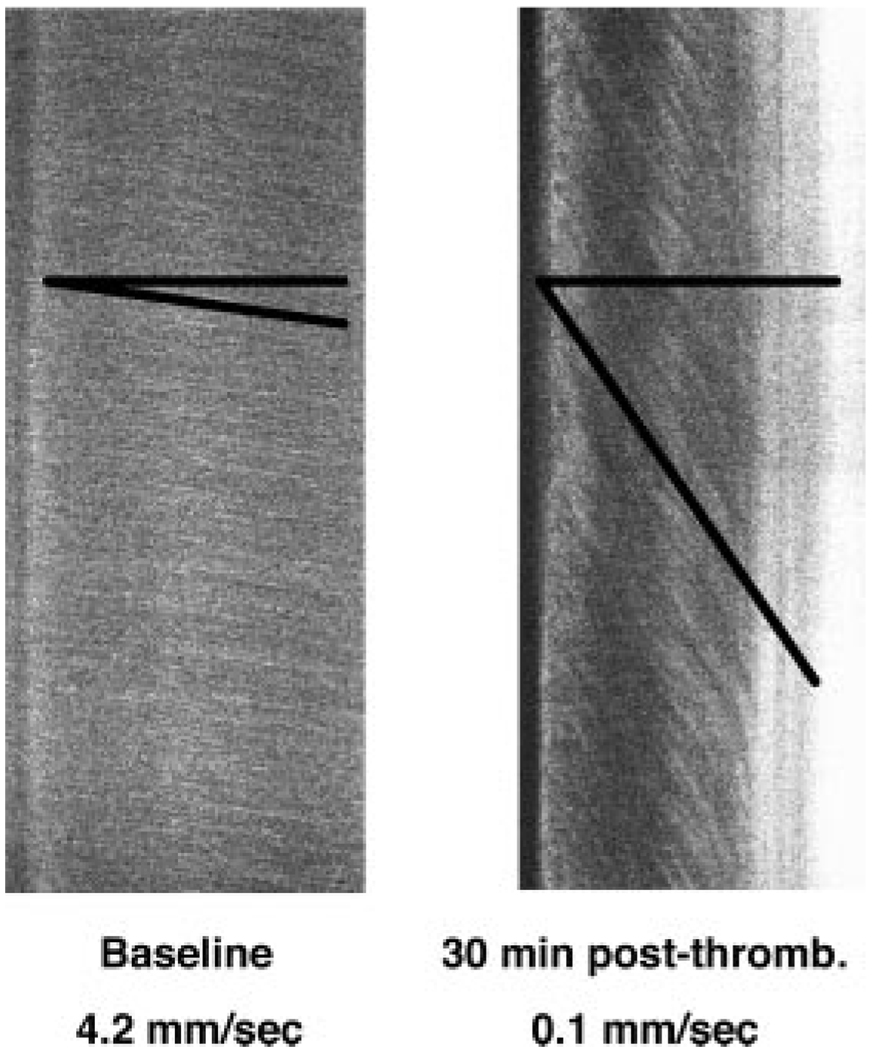
Figure 3.
Examples of line-scans used to measure microvascular flow-velocity along the longitudinal axis of arterioles of interest. Top-to-bottom sweep-duration is 1024 ms. The slopes (Δx/Δt) of the measurement-angles are proportional to flow velocity. Left: rapid baseline flow velocity; right, markedly reduced flow velocity distal to arteriolar thrombosis.

