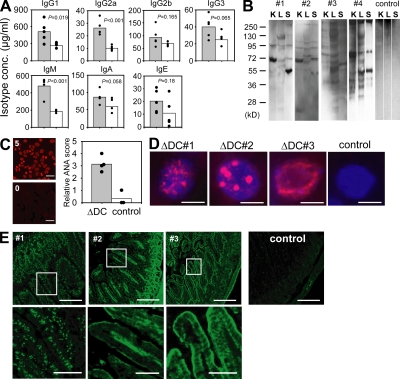
Figure 8.
Hyperimmunoglobulinemia and autoantibodies in ΔDC mice. (A) Immunoglobulin isotype concentrations in the serum of ΔDC mice (filled bars) or controls (open bars). n = 5 from two independent experiments. (B) Western blot analysis showing the staining pattern of autoantibodies present in the serum of four individual ΔDC mice and one control on total cell extracts of kidney (K), liver (L), and spleen (S) from Rag-deficient mice. (C) ANAs were scored between 0 (negative control serum from WT mice) and 5 (positive control serum from MRL/lpr mice) by determining the staining intensity on Hep2 cells. Filled bar, serum from ΔDC mice; open bar, serum from control mice. Bars, 10 µm. The filled circles show results from individual mice. The bars show the means. (D) Different staining pattern of nuclear structures by ANAs (red) from three individual ΔDC mice and a negative littermate control on liver sections from Rag-deficient mice. DAPI staining is shown in blue. Original magnification was 480×. Bars, 5 µm. (E, top) Staining pattern of autoantibodies from three individual ΔDC mice (#1–3) and a negative littermate on sections from the small intestine of Rag-deficient mice. Bars, 200 µm. (E, bottom) Magnified view of the areas indicated in the top. Bars, 40 µm.

