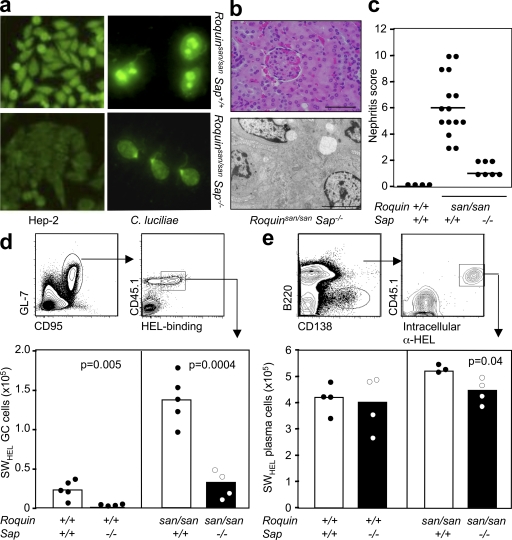
Figure 5.
Serum autoantibodies and renal pathology in Roquinsan/san Sap−/− mice and reduction of the GC response in SAP-deficient Roquinsan/san mice is caused by B cell–extrinsic factors. (a, left) Representative staining of Hep-2 slides for detection of IgG ANA in the serum of 8-wk-old female Roquinsan/san and Roquinsan/san Sap−/− mice (n = 5 per group). (right) Detection of IgG anti-dsDNA serum antibodies in 6-mo-old female Roquinsan/san and Roquinsan/san Sap−/− mice determined by immunofluorescence staining using C. luciliae substrate. Data are representative of three independent experiments (n ≥ 5 per group). (b) Representative images of kidney sections stained with H&E (top) or viewed under an electron microscope (bottom) from 6-mo-old female Roquinsan/san Sap−/− mice. Roquinsan/san Sap−/− mice show slight mesangial expansion on H&E staining but no electron-dense deposits. Bars: (top) 100 µm; (bottom) 5 µm. (c) Score of nephritis severity in 6-mo-old female Roquin+/+, Roquinsan/san, and Roquinsan/san Sap−/− mice as determined by histological analysis according to the criteria given in Table S1 (available at http://www.jem.org/cgi/content/full/jem.20081886/DC1). Each symbol represents one mouse. Horizontal bars indicate medians. (d) Gating strategy for assessing the HEL-specific GC response (top) and graphic representation (bottom) of the total number of HEL-specific GC cells per spleen in mice with the indicated genotypes 7 d after cotransfer of SWHEL B cells and HEL2x-conjugated SRBCs. Data are representative of three independent experiments (n ≥ 4). Each symbol represents one mouse. (e) Gating strategy for determining HEL-specific extrafollicular plasma cells (top) and graphical representation (bottom) of the number of HEL-specific plasma cells 5 d after cotransfer into mice with the indicated genotypes. Data are representative of two independent experiments (n ≥ 3 per group). p-values are indicated on graphs.

