Figure 5.
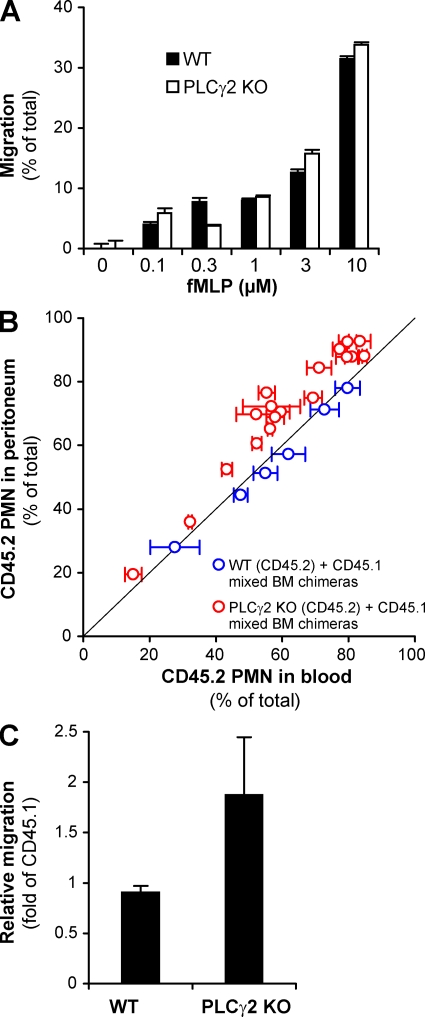
Normal in vitro and in vivo migration of PLCγ2−/− neutrophils. (A) Migration of WT and PLCγ2−/− (PLCγ2 KO) neutrophils toward the indicated concentrations of fMLP through fibrinogen-coated transwell membranes of 3-µm pore size. Error bars represent SD of duplicate readings. Data are representative of three independent experiments. (B and C) Competitive migration of CD45.2-expressing and CD45.1-expressing neutrophils during thioglycollate-induced sterile peritonitis in mixed bone marrow chimeras. (B) Percentage of CD45.2-expressing WT or PLCγ2−/− cells in the blood and the peritoneal lavage fluid. Each data point represents an individual mouse. The thin diagonal line marks points of identical percentage of CD45.2 cells in the blood and the peritoneum. Error bars represent SD from three blood samples taken at different time points from the same mouse. The data are combined from two independent experiments. (C) Relative migratory capacity of CD45.2-expressing WT or PLCγ2−/− neutrophils relative to the CD45.1-expressing cells calculated from the data presented in B. Error bars represent SD of values from 6 (WT) or 18 (PLCγ2−/−) individual mice.

