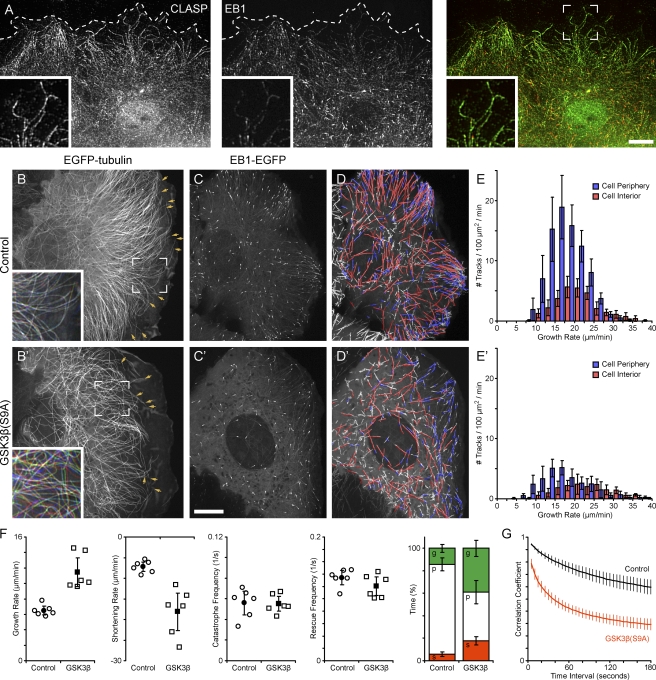
Figure 1.
Ectopic GSK3β activation increases lamella MT dynamics. (A) Immunofluorescence of endogenous CLASP and EB1 in migrating HaCaT keratinocytes. Dashed lines indicate the cell's leading edge. Insets show a peripheral cell region at a higher magnification. (B) Migrating HaCaT keratinocyte expressing EGFP-tubulin. (B and B′) Arrows indicate MTs that are part of the quantification in F, and insets show an overlay of images from the original time-lapse sequence acquired at 0, 30, and 60 s. The colors indicate lateral movement of MTs during this time period. (C) HaCaT cell expressing EB1-EGFP. (D) Computer-generated tracks of EB1 comets over 38 s (99 frames) overlaid on a maximum intensity projection of the entire sequence. Red indicates growth rates above and blue below the median. Only tracks with a lifetime of >4 s (10 frames) are shown. (E) Histogram of growth rates in the cell periphery (blue) and cell interior (red). (B–E) Control HaCaT cells. (B′–E′) HaCaT cells expressing constitutively active mRFP-GSK3β(S9A). (F) Analysis of lamella MT polymerization dynamics in control and GSK3β(S9A)-expressing cells. Open symbols indicate parameters calculated from individual cells, and closed symbols indicate means. The bar graph summarizes time MTs spent growing (g), pausing (p), or shortening (s). (G) Plot of the correlation coefficient between image regions in the lamella of EGFP-tubulin–expressing cells as a function of the time interval between images. Error bars indicate 95% confidence intervals; n = 6 cells. Bars, 10 µm.

