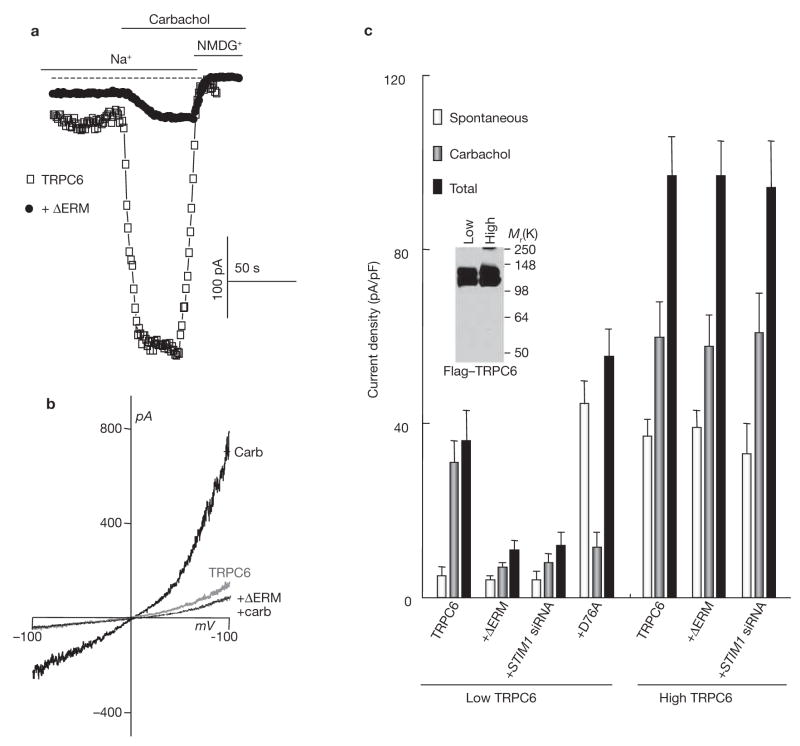
Figure 4.
Regulation of TRPC6 by STIM1. (a) HEK cells were transfected with Flag–TRPC6 alone or Flag–TRPC6 and the indicated constructs of STIM1. The experimental protocol was the same as in Fig. 1. Whole-cell current recording measured in cells transfected with TRPC6 alone or with TRPC6+ΔERM–STIM1D76A is shown. (b) The I/V relationships of HEK cells expressing TRPC6 before (grey trace) and after (thick dark trace) stimulation with carbachol, and of cells transfected with TRPC6 and ΔERM–STIM1D76A and stimulated with carbachol (thin dark trace). (c) The blot shows the level of Flag–TRPC6 expression under the indicated conditions and the graph summarizes the results of six experiments with low and four experiments with high TRPC6 levels. The spontaneous current density measured before cell stimulation, the current activated by carbachol and the total current are plotted. Cells were transfected with low or high levels of TRPC6 alone or together with ΔERM–STIM1D76A or D76A–STIM1 and in cells treated with STIM1 siRNA, as indicated. Cells with high levels of TRPC6 were transfected with three times more cDNA than cells with low level of TRPC6. Note that ΔERM–STIM1D76A and STIM1 siRNA inhibited TRPC6 and STIM1D76A increased the spontaneous activity of TRPC6 only when TRPC6 was expressed at low levels. The error bars indicate the mean ± s.e.m.

