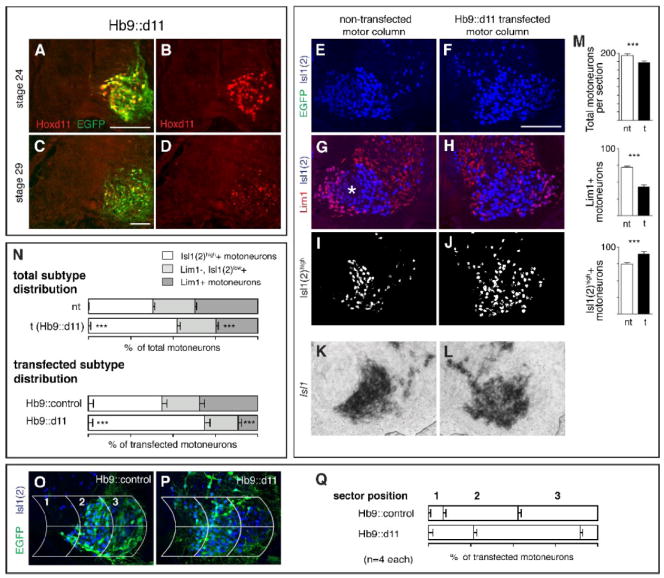
Figure 5.

Ectopic expression of Hoxd11 via transfection with an Hb9 promoter construct (Hb9∷d11) leads to a shift in MN subtype complement in favor of medial subtypes. A-C. Ectopic Hoxd11 expression at rostral LS levels at stages 24 and 29 and co-localization with EGFP after transfection with Hb9∷d11. E-H. LIM expression on transfected and non-transfected sides in a triple-labeled LS2 section from an Hb9∷d11 embryo. (EGFP for this section shown in P). Asterisk in G denotes region of Lim1-, LMCl MNs that stain lightly with Isl1(2). I-J. Distribution of Isl1(2)high cells after using a fluorescent intensity cut-off to subtract out Isl1(2)low cells. K-L. Distribution of Isl1 mRNA on transfected and non-transfected side of LS2 from a second Hb9∷d11 embryo. Note that Isl1(2)high cells correspond positionally to Isl1+ cells. M. Histograms showing mean numbers of total MNs and subtypes per section on transfected (t) and non-transfected (nt) sides. N. Subtype percentages within transfected and non-transfected motor columns as a whole and within the transfected (EGFP+) population alone in Hb9∷control and Hb9∷d11 embryos. O-Q. Grid placement on sections of transfected motor columns from Hb9∷control and Hb9∷d11 embryos and percentages of transfected MNs in individual grid sectors. Paired t-tests as in Fig. 2. See Table 1 for (n). Scale bars=100μm.
