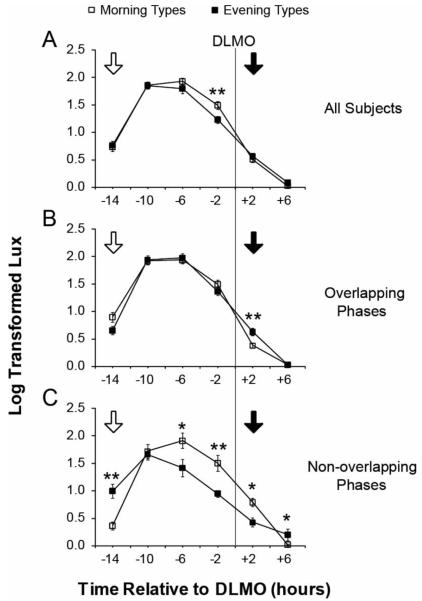
FIGURE 3.
Light exposure in morning types (open squares) and evening types (closed squares) plotted relative to the 10 pg/ml dim light melatonin onset (DLMO). The average log-transformed light data are binned into six 4 h bins. Results are presented for (A) the entire data set, (B) subjects with overlapping phases, and (C) subjects with non-overlapping phases. The approximate timing of maximal phase advances and phase delays are indicated by white and black arrows, respectively. Error bars represent the standard error of the mean. *p < 0.05, **p < 0.01.

