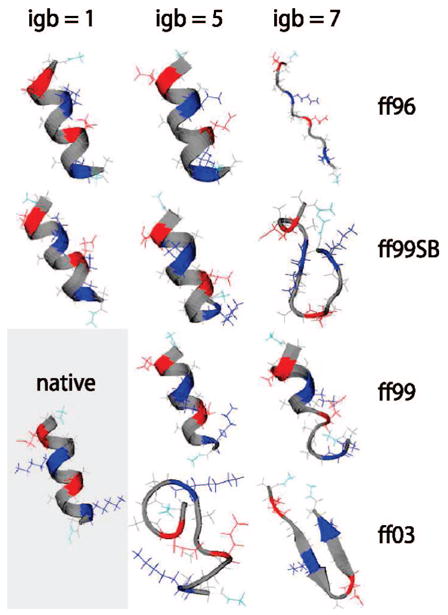
Figure 1.

Top cluster conformations for the EK peptide from replica exchange simulations. The conformation with the most secondary structure among the dominant clusters of the three repeat runs for each force field/solvent combination is shown. Colors are residue-specific: gray, hydrophobic; green, polar; red, negatively charged; blue, positively charged. The presumed native configuration is shown at the bottom left. The solvent model igb1 was not tested with ff99 and ff03.
