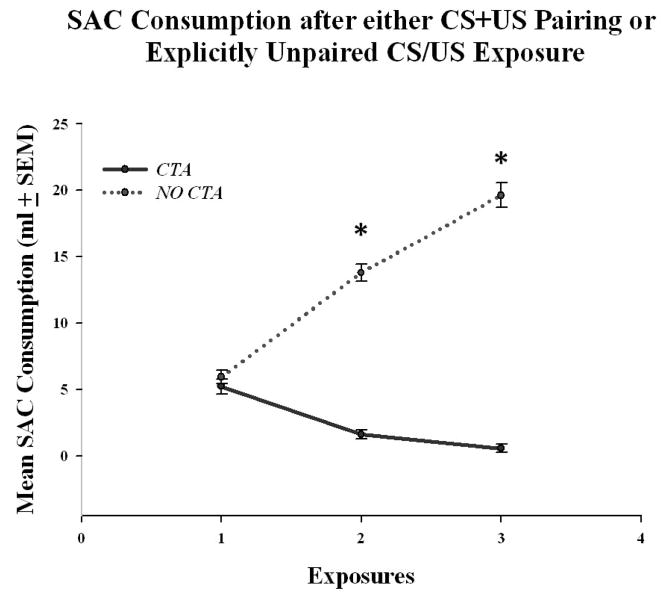
Figure 1.
Mean volume of SAC consumption (± SEM) after either three CS+US pairings (CTA) or three explicitly unpaired CS/US exposures (NO CTA). The CTA group showed a significant decrease in the amount of SAC consumed over the three exposures. The NO CTA group showed a significant increase in SAC consumption over the same three periods. This indicates that the CTA groups had acquired the CTA, whereas the NO CTA group did not. * = significantly different from the CTA animals (α = 0.05).

