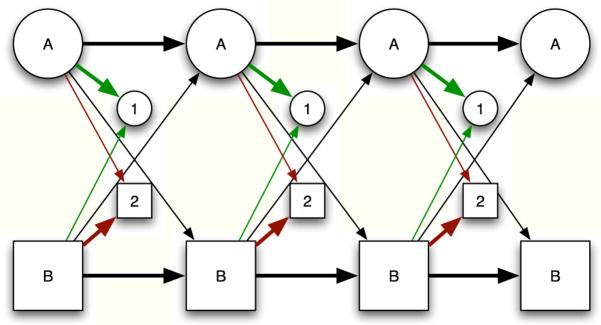
Fig. 2.
Schematic diagram of a hidden Markov model for single-molecule photon trajectory data using a two-state exchange model including background and crosstalk. The circles represent the state of the molecule at the time a photon is emitted/detected into a particular detector (squares). The model can transition between states depending on the transition probabilities determined the time elapsed since the previous photon detection event and the kinetic model. Each transition corresponds to the detection of a photon. The photon can arrive in either channel 1 or channel 2, with appropriate probabilities. The thickness of the transition arrows is intended to approximately convey relative a priori likelihood of the transition occurring.

