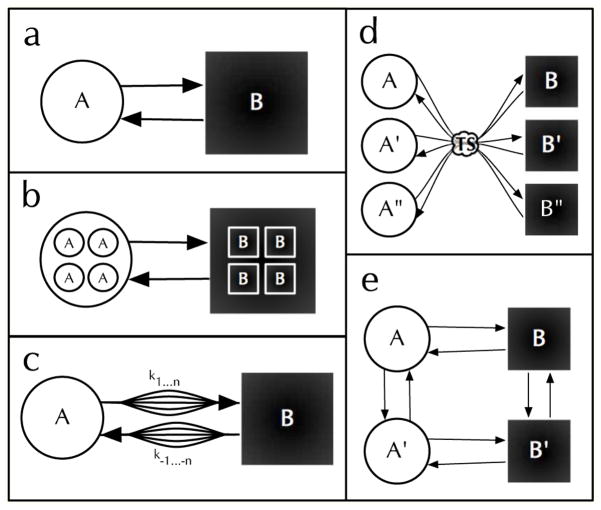
Fig. 3.
Illustration of semi-Markov processes. a) A two state system at equilibrium fluctuates between the brighter macrostate (A) and the dimmer macrostate (B), but b) there may be many microstates within the macro states. c) When the dynamics between microstates are slow enough and those dynamics influence the two-macrostate fluctuation rate, semi-Markovian dynamics occur. d) The structure of the free energy surface influences semi-Markov dynamics. In this case the energy of the microstate is set upon exiting the common transition state, and e) the 2 × 2 fluctuating activation barrier model also shows semi-Markov statistics.

