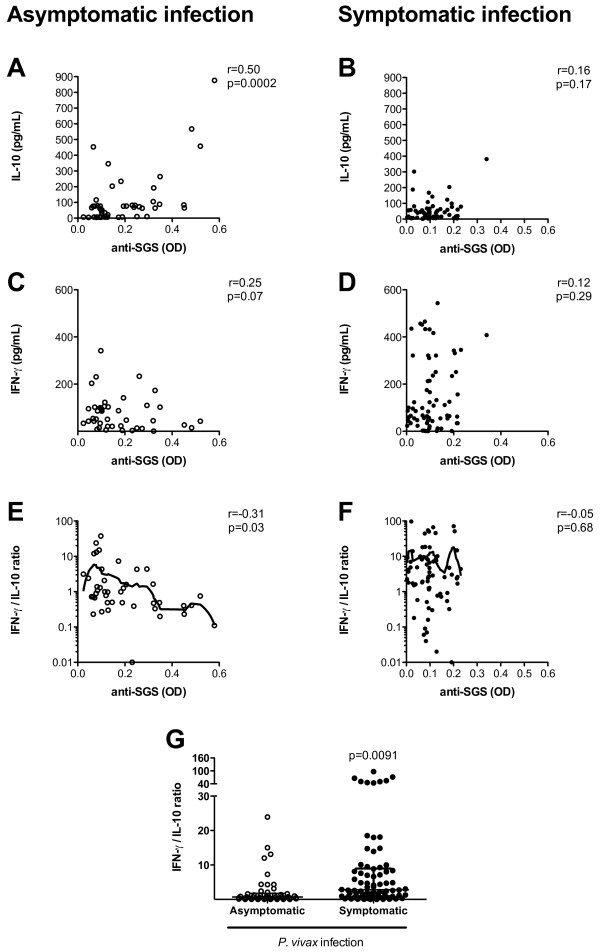
Figure 4.
Correlation between cytokine plasma levels and anti-saliva IgG titers. (A) IL-10 vs. anti-SGS (OD), (B) IFN-γ, and (C) IFN-γ/IL-10 ratio vs. anti-SGS in patients with asymptomatic P. vivax infection. (D) IL-10 vs. anti-SGS (OD), (E) IFN-γ, and (F) IFN-γ/IL-10 ratio vs. anti-SGS in patients with symptomatic P. vivax infection. Fine Lowess curves are shown in (C) and (F) to evidence the trend of the data. Non-parametric Spearman test was used to verify statistical significance. (G) Comparison of IFN-γ/IL-10 ratio between volunteers with asymptomatic or symptomatic P. vivax infection. Mann-Whitney test was used to estimate the significance. P values, together with r values, are plotted in each graph.

