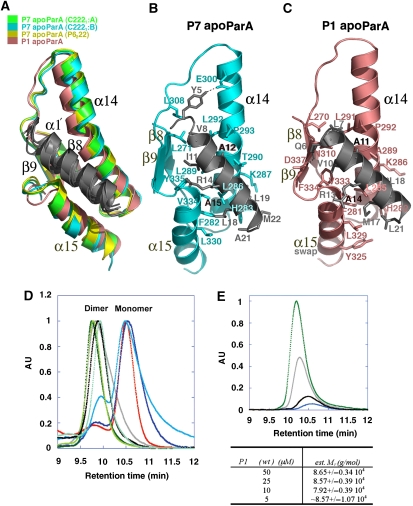
Figure 3.
The conserved ParA α1–C-domain′ dimer interface. (A) Superimposition of β8, α14, β9 and α15 of the P7 apoParA and the P1 apoParA structures, which results in a superimposition of α1′. α1 is coloured grey, whereas β8, α14, β9 and α15 are coloured green for the P7 apoParA (C2221 A dimer), blue for the P7 apoParA (C2221 B dimer), yellow for the P7 apoParA P6222 structure and salmon for the P1 apoParA structure. α15 of the P1 structure is from the other subunit due to domain swapping. (B) α1–C-domain′ contacts in the P7 apoParA structure. Shown as sticks are the residues mediating interactions. Residues Ala12 and Ala15 corresponding to Ala11 and Ala14 in P1 ParA are labelled in black. (C) α1–C-domain′ contacts in the P1 apoParA structure. (D) SEC-LS analysis of ParA oligomer state. For clarity, the portion of the chromatogram used for the analysis for the monomer and dimer states has been shown. Samples fall into two groups characterized by their molecular masses (mw) as calculated using ASTRA software; a dimeric state: P1 ParA, wt (jade; mw=8.86±0.02 104 g/mol), P7 ParA, wt (black; mw=8.73±0.07 104 g/mol), P1 ParA (T278W) (green; mw=1.00±0.01 105 g/mol), P1 ParA with C-terminal tag (light green; mw=9.16±0.82 104 g/mol) and ParA (A277Y) (grey; mw=1.00±0.01 105 g/mol); or monomeric state: ParA (Δnt20) (red; mw=4.99±0.03 104 g/mol), ParA (A14S) (blue; mw=5.14±0.11 104 g/mol) and ParA (A11S) (aqua; mw=6.27±0.05 104 g/mol). (E) SEC-LS carried out at the lower limit of detection showing ParA dimers. P1 ParA was measured at 50 μM (green), 25 μM (grey), 10 μM (black) and 5 μM (blue).

