Figure 3.
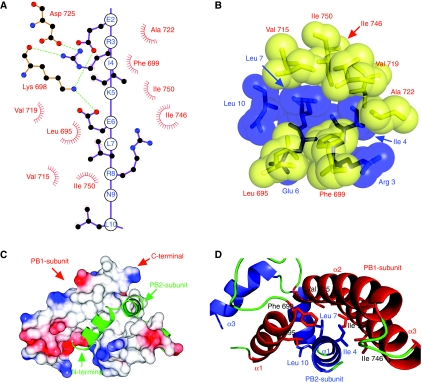
Interactions between PB1 and PB2. (A) A schematic diagram showing the interactions between the two polypeptides. Helix 1 of PB2-N is drawn as a linear model, with the side chains touching PB1 shown in a two-dimensional ball and stick form. Lys 698 and Asp 725 of PB1 form the only salt bridges across the interface, shown as green dotted lines. These salt bridges are not found in every copy of the complex, and mutation studies (replacing Glu 2 or Arg 3 with alanine) show that they have little effect on PB1–PB2 binding (data not shown). Apolar residues of PB1 are shown in red as simple dashed arcs to indicate hydrophobic contacts between 3.4 and3.9 Å in length. This figure was prepared using LIGPLOT (Wallace et al, 1995). (B) A space-filling representation, with PB1 residues shown in yellow and labelled in red. PB2 residues are shown and labelled in blue. The van der Waals surface of each atom is shown semi-transparent. (C) Schematic diagram showing the molecular surface of PB1, coloured by charge (blue positive, red negative). The potential scale ranges from −1 kT/e (red) to 1 kT/e (blue). PB2 is shown as a green ribbon to reveal the PB1-binding surface beneath it is largely apolar. (D) A ribbon diagram showing the helices of PB1-C and PB2-N in red and blue, respectively, with coil regions in green. Side chains selected for mutagenesis are shown as stick models.

