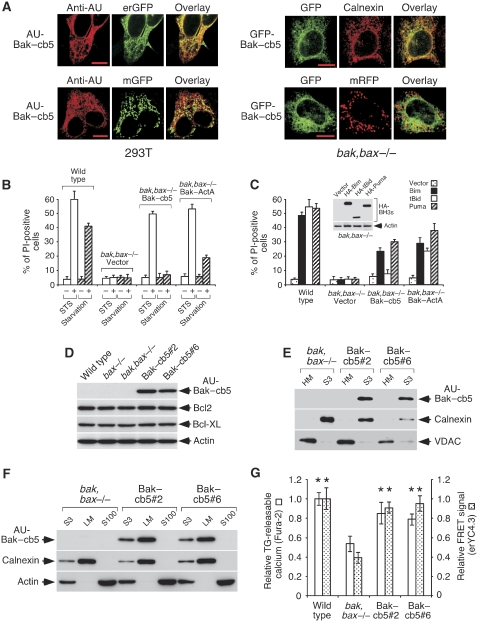
Figure 1.
Reticular expression of Bak–cb5 in bak,bax−/− MEFs. (A) Transfected Bak–cb5 localizes to the ER. 293T cells (left panels) were co-transfected with AU-Bak–cb5 and erGFP or mGFP, and stained for AU 24 h later. Bak,bax−/− MEFs (right panels) were transfected with GFP-Bak–cb5 in the absence or presence of mRFP, and stained for calnexin (top) or directly mounted (bottom), 24 h later. Pictures show colocalization of Bak–cb5 with reticular (erGFP, left; calnexin, right), but not mitochondrial (mGFP, left; mRFP, right) markers. (B) Polyclonal Bak–cb5-expressing MEFs die in response to STS treatment, but not serum starvation. The indicated cells were treated with STS (1 μM) or serum starvation for 24 or 36 h, respectively, and death was evaluated by propidium iodide (PI) staining. (C) Polyclonal AU-Bak–cb5-expressing cells undergo Bim- and Puma-induced apoptosis. Cells were transduced with the indicated BH3-only molecules and analysed for cell death by PI staining 24 h later. The inset shows expression of HA-Bim, HA-tBid and HA-Puma in bak,bax−/− MEFs, 24 h after transduction (anti-HA western blot). Bak,bax-deficient cells were used to avoid an influence of the induced death in expression levels. (D) Expression of AU-Bak–cb5, Bcl2 and Bcl-XL in clones #2 and #6. Total lysates were subjected to western blotting. (E) AU-Bak–cb5 is excluded from mitochondria in clones #2 and #6. Equal protein amounts were subjected to western blotting for AU, calnexin and VDAC. HM, heavy membranes; S3, post-mitochondria supernatant. (F) AU-Bak–cb5 co-purifies with calnexin in the microsomal fraction. Equal amounts of protein from the post-mitochondria supernatant (S3), light membranes (LM) or the post-microsome supernatant (S100) were subjected to western blotting for AU, calnexin or actin, as shown. (G) Recovered levels of reticular calcium in Bak–cb5-expressing clones. The amount of TG-releasable calcium (left bars) and the FRET signals provided by transduced erYC4.3 (right bars) are represented as a fraction of the values obtained for wild-type MEFs. Shown are averages and standard deviations (error bars) of the values obtained from three independent experiments. Asterisks indicate significant differences (Student's t-test) with respect to bak,bax−/− MEFs (P<0.05).

