
Figure 3. Gene expression patterns of the miRNAs depicting increased levels during erythroid differentiation.
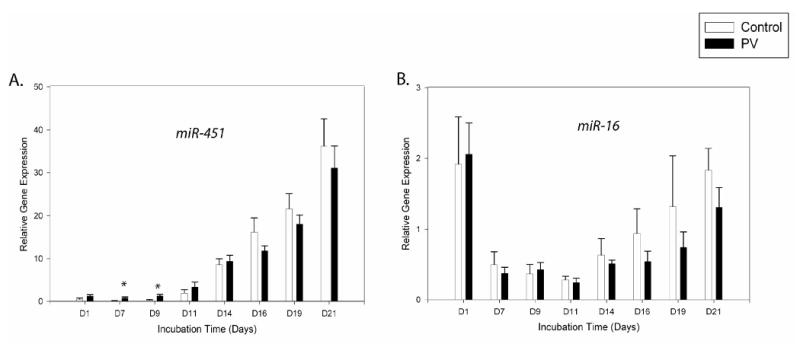
Gene expression was determined by qRT-PCR at the defined time points. Relative gene expression was calculated based on generation of standard curve and normalized against the endogenous control RNAU6B. The plotted data (arbitrary units) express as mean with standard error. Statistical significance between control and PV cells was calculated by t-test at each time point (*P<0.05, **P<0.01). Control - healthy controls, PV- polycythemia vera patients, D – day.