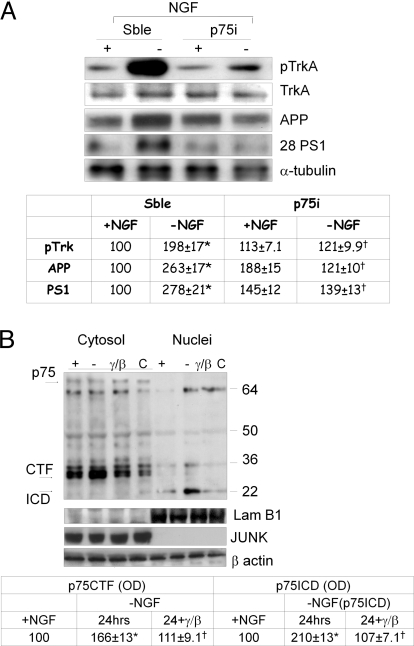
Fig. 2.
(A) Western blot analysis of pTrkA, TrkA, APP, and 28-kDa PS1 N-terminus fragment (28 PS1) in p75-silenced neurons (p75i) after 24 h of NGF removal and in the corresponding scramble samples. pTrkA densitometric values were normalized using full-length TrkA (TrkA) values as internal control (see Table at bottom). All data represent means ± SEM from 4 independent experiments. *, P < 0.05 vs. +NGF values; †, P < 0.05 vs. -NGF values of the corresponding scramble samples. (B) Cytosolic and nuclear fractions Western blot analysis performed with p75 C-terminus antibody (see Methods). C, neurons before NGF exposure; +, neurons after NGF exposure; -, 24-h NGF- deprived neurons; γ/β, NGF-deprived neurons incubated with γ/β secretase inhibitors. Optical density analysis of CTF and ICD fragments is reported in the Table at bottom. Data were normalized on the basis of the correspondent β-actin values to assess that equal amounts of protein were loaded on gel. *, P < 0.05 vs. +NGF; †, P < 0.05 vs. -NGF values. The same samples loaded in equal amount and run on different gel were probed with JUNK and Lamin B1 antibodies to determine the purity of nuclear and cytoplasmic fractions. Arrows mark CTF (30–32 kDa) and ICD (22 kDa) bands. Western blot showing the effect of Abeta 1-42 exposure on p75 processing is reported in Fig. S3a.

