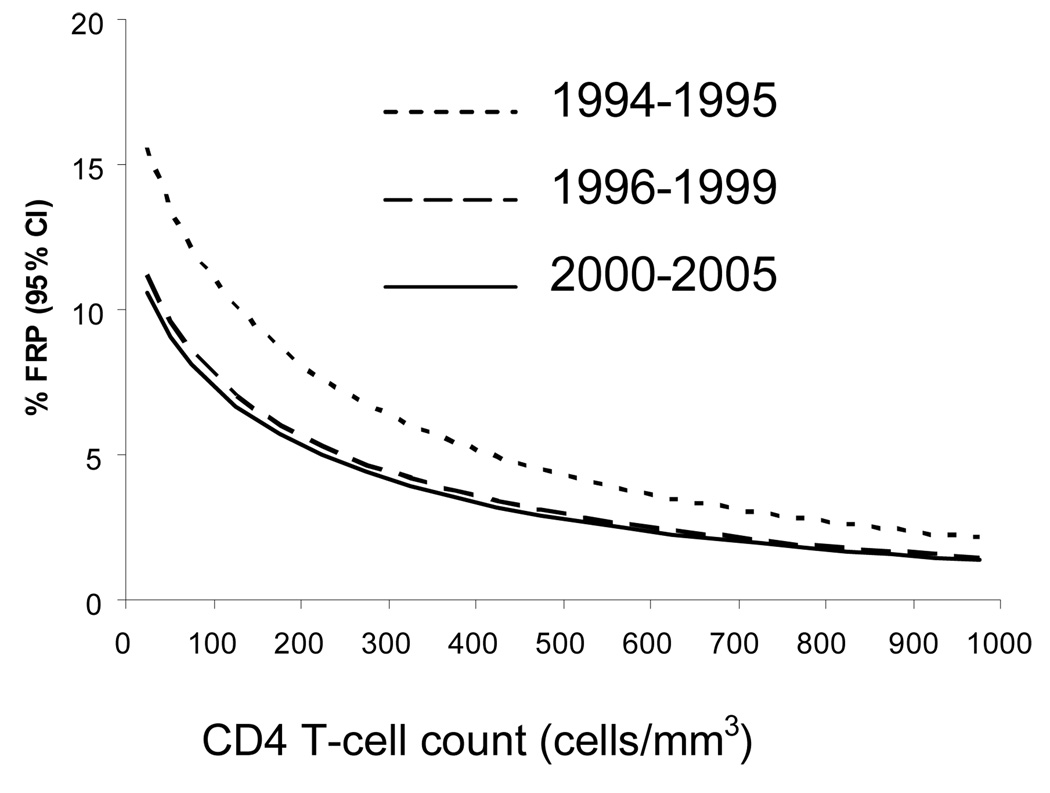
Figure 1.
Estimated prevalences of a frailty-related phenotype (FRP) as a function of CD4 T-cell count in the MACS for fixed values of age (45 years), fixed percentage for ethnicity (80% White non Hispanic), education (52% ≥ college), and prevalence of AIDS (20%), in the pre-HAART era (1994–1995; dotted line), introduction of HAART era (1996–1999; dashed line), and established HAART era (2000–2005; plain line). The curves for the two HAART eras do not differ significantly from each other, but both are significantly different from that of the pre-HAART era (see text for Odds Ratios and p-values comparing the three different eras).

