Figure 2.

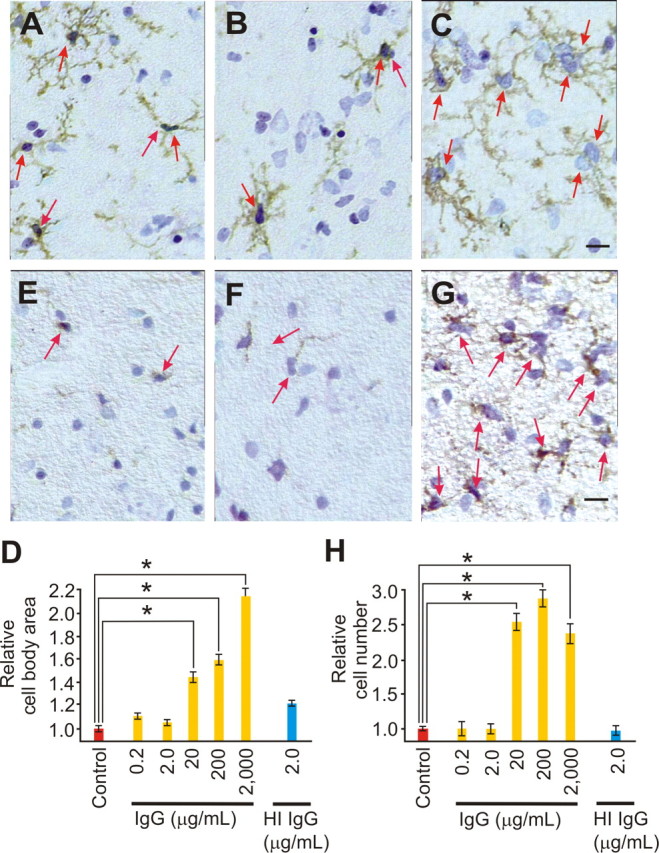
IgG evoked a nonlinear, progressive activation of slice culture microglia. A–D, Immunostaining images for CD11b, counterstained with toluidine blue, are shown under control conditions (A) or after 3 d of IgG [2.0 μg/ml (B) and 2000 μg/ml (C)] and quantified (D) as cell body area (red arrows), a morphological marker for microglia activation, relative to control. Control immunostaining (A) shows typical ramified microglial morphology with evenly but sparingly spaced cells. Three day exposure to low [0.2 and 2.0 (B) μg/ml] IgG had no impact on microglial cell body area, whereas 20, 200, and 2000 (C) μg/ml prompted a significant (p < 0.001; α = 1.00) increase (D) in cell body area, a process that includes addition of internal membrane to the cell surface. Heat inactivation (HI) of IgG (2.0 μg/ml) had no effect on cell body area [with relative microglial sizes of 1.05 ± 0.05, 1.19 ± 0.05, 1.43 ± 0.10, 1.57 ± 0.10, 2.14 ± 0.19 and 1.00 ± 0.05 vs control (1.00 ± 0.05; n = 18 cells from ≥3 slice cultures/group)]. E–H, Immunostaining for ED-1, a marker for late endosomes or early lysosomes; thus, when increased, microglial activation followed a similar nonlinear pattern from IgG. ED-1 positive cells (red arrows) are shown under control conditions (E) or after 3 d of IgG [2.0 μg/ml (F) and 2000 μg/ml (G)] and quantified (H) as relative cell number from control. Low-dose IgG (0.2 and 2.0 μg/ml) had no effect on cell number, but higher doses [20, 200, and 2000 (G) μg/ml] evoked a significant (p < 0.001; α = 1.00) increase in positive cell number. HI IgG (2.0 μg/ml) had no effect on ED-1 positive cell number [with relative number of ED-1 positive cells of 0.95 ± 0.13, 1.00 ± 0.13, 2.54 ± 0.24, 2.85 ± 0.24, 2.36 ± 0.38 and 0.98 ± 0.20 vs control (1.00 ± 0.07; n = 6 image fields from ≥3 slice cultures/group)]. Scale bars, 25 μm. Images were taken from basilar CA1 dendritic area. Data represent mean ± SEM and significance (*p < 0.05).
