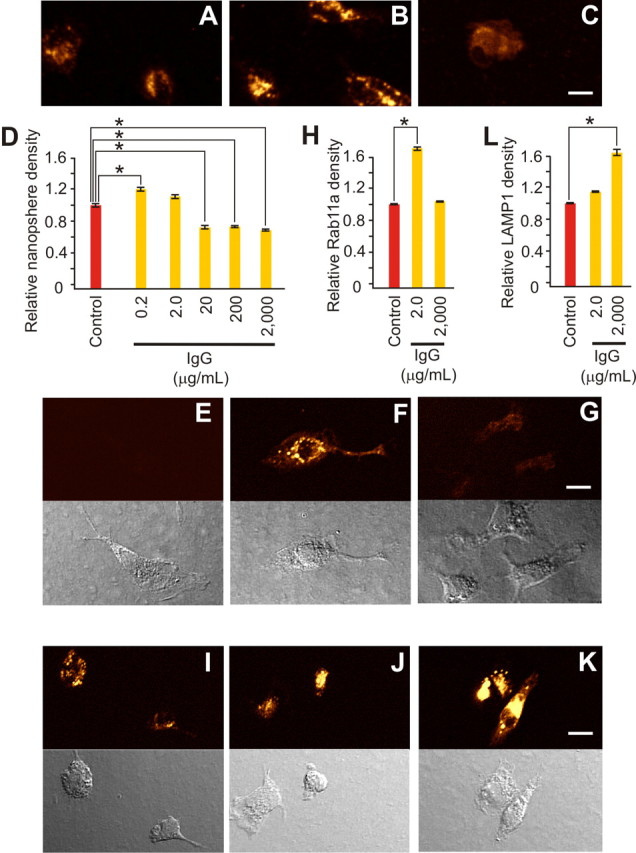
Figure 3.

Neuroprotective levels of IgG selectively increased primary microglial recycling endocytosis. A–D, Endocytosis of 20 nm fluorescent beads for 20 min is shown under control conditions (A) and after inclusion of IgG [2.0 μg/ml (B) or 2000 μg/ml (C)] and was quantified (D) as relative fluorescence density compared with control. Low (0.2 μg/ml) IgG triggered a significant (p < 0.001; α = 1.00) increase in endocytosis, whereas 2.0 μg/ml had no effect, and higher doses (20, 200, and 2000 μg/ml) triggered significant (p < 0.001; α = 1.00) decreases [with relative levels of 1.20 ± 0.04 (n = 131 cells), 1.10 ± 0.05 (n = 72), 0.68 ± 0.04 (n = 70), 0.72 ± 0.02 (n = 112) and 0.67 ± 0.02 (n = 114) versus control (1.00 + 0.04; n = 107)]. Immunostaining for specific endosomal subtypes (E–G and I–K, with related phase contrast images shown immediately below) parallel this U-shaped impact of monomeric IgG on endocytosis. E–H, RAB11a immunostaining, a marker for recycling endocytosis, showed a significant increase (p < 0.001; α = 1.00) from control (E) only at the neuroprotective IgG dose of 2.0 μg/ml (F) and not at 2000 μg/ml (G) (or in the absence of added IgG control), with measurements quantified as relative fluorescence intensity compared with control (H). [Respective relative levels were 1.68 ± 0.12 (n = 111 cells) and 1.00 ± 0.04 (n = 104) versus (control 1.00 ± 0.04; n = 92)]. I–L, LAMP1 immunostaining, a specific marker for late endosomes or early lysosomes, showed a rise from control (I) after 2.0 μg/ml (J) that became significantly (p < 0.001; α = 1.00) greater than control at 2000 (K) μg/ml IgG [with (L) relative levels of 1.13 ± 0.05 (n = 135) and 1.65 ± 0.14 (n = 124) vs control (1.00 ± 0.05; n = 105)]. Scale bars, 10 μm. Data represent mean ± SEM and significance (*p < 0.05).
