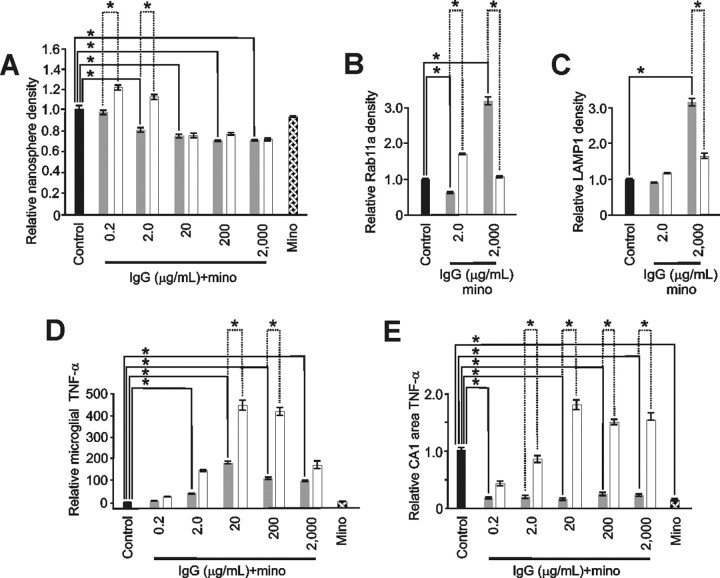
Figure 7.
Minocycline abrogated microglial changes induced by neuroprotective levels of IgG. A–C, Minocycline (mino) pretreatment (gray) significantly abrogated nanosphere endocytosis (A) at 0.2 and 2.0 μg/ml IgG (p < 0.001; α = 1.00). Minocycline had no impact on IgG-induced significant (p < 0.001; α = 1.00) reductions in nanosphere endocytosis seen at higher IgG doses (20–2000 μg/ml) and had no impact alone on nanosphere uptake. Similarly (B), minocycline significantly abrogated the increased IgG-mediated recycling endocytosis evidenced by RAB11a immunostaining at 2.0 μg/ml IgG but in contrast significantly enhanced this endosomal trafficking at 2000 μg/ml IgG. Minocycline also significantly increased (p < 0.001; α = 1.00) lysosomal endosomes (C) at 2000 μg/ml IgG. For comparison, respective changes without minocycline (white) from Figures 3 and 4 are shown. D, E, Importantly, these latter increases in endosomes at high dose IgG did not occur with concomitant increased expression of TNF-α indicating that minocycline could differentially impact endosomal trafficking and otherwise related TNF-α production. For example, minocycline pretreatment (gray) reduced IgG-mediated changes in TNF-α (white) from microglia (D) and the CA1 area of slice cultures (E). In primary microglia, these reductions were significant (p < 0.001; α = 1.00) at 20–2000 μg/ml IgG but continued to show a U-shaped response over the full IgG treatment range. In contrast, although also significantly (p < 0.001; α = 1.00) reducing IgG-induced TNF-α production at 2–2000 μg/ml, the reduced levels were constant over the IgG treatment range. Furthermore, minocycline alone significantly (p < 0.001; α = 1.00) reduced TNF-α production in slice cultures but not primary microglia. [Specific relative levels were (A) 0.94 ± 0.04 (n = 110 cells), 0.77 ± 0.04 (n = 98), 0.72 ± 0.02 (n = 98), 0.63 ± 0.02 (n = 110), 0.63 ± 0.02 (n = 112) and 0.89 ± 0.04 (n = 182 cells) vs control (1.00 ± 0.04; n = 107); (B) 0.50 + 0.05 (n = 91 cells) and 3.17 ± 0.26 (n = 142 cells) vs control (1.00 + 0.08; n = 195); (C) 0.87 ± 0.03 (n = 286) and 3.16 ± 0.26 (n = 201 cells) vs control (1.00 ± 0.05; n = 158); (D) 9 ± 5.0, 51 ± 5.0, 169 ± 16, 107 ± 12, 85 ± 15, and 2 ± 0.20 vs control (1.00 ± 0.10) and all groups n = 6 culture dishes per group; (E) 0.16 ± 0.03 (n = 10), 0.18 ± 0.07 (n = 7), 0.14 ± 0.04 (n = 9), 0.23 ± 0.07 (n = 12), 0.22 ± 0.07 (n = 12), and 0.13 ± 0.04 (n = 13) vs control (1.00 ± 0.10; n = 20 slices per group)]. Data represent mean ± SEM and significance (*p < 0.05).

