
Figure 7.
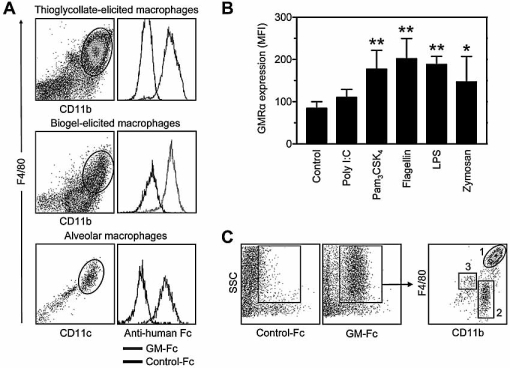
Expression of GMRα by macrophages and characterisation of myeloid cells. (A) Inflammatory peritoneal macrophages were elicited by intraperitoneal administration of thioglycollate broth (top panels) or biogel (middle panels) for 4 days. GMRα expression was analysed by FACS along with the macrophages identified by F4/80 and CD11b profiles (gated regions). Alveolar macrophages were isolated from lung lavage and gated in accordance with the expression of F4/80 and CD11c (bottom panels). GM-Fc (right panels, grey lines), when compared to control-Fc (right panels, black lines), bound specifically and at high levels to the macrophage populations. (B) RAW264.7 cells were stimulated with 100 ng/mL poly(I:C), Pam3CSK4, flagellin or LPS or 5×10⁶ particles/well of zymosan. After 24 h, binding of GM-Fc was assessed by FACS. Data represent the results of four independent experiments and error bars are the SD. Data were analysed by repeated measures one-way ANOVA with Dunnet's post test; *p<0.05, **p<0.01. (C) We used GM-Fc to identify GMRα-expressing cells in the resting peritoneal cavity (upper panels). Gating on GMRα+ cells identified three populations of myeloid cells, which expressed distinct levels of the myeloid markers CD11b and F4/80 (populations 1–3, upper right panel). The physical FSC/SCC profiles of three populations are shown in the lower panels. Population 1 exhibits the classic F4/80highCD11bhigh phenotype of resident peritoneal macrophages. The second F4/80lowCD11bhigh population also expressed MHC class II and exhibited dendritic cell-like characteristics (Dioszeghy et al., manuscript in preparation) and the third rarer population shared the phenotype of eosinophils.