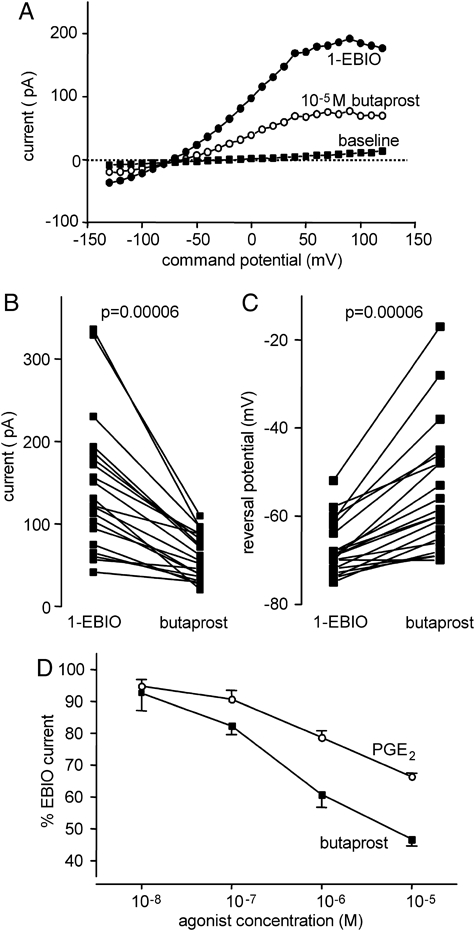
Figure 2.

The EP2 receptor agonist butaprost closes KCa3.1 in HLMC. (A) Current–voltage curve demonstrating suppression of a 1-EBIO-induced KCa3.1 current by 10−5 butaprost. (B) Suppression of KCa3.1 current measured at +40 mV by 10−5 M butaprost (n=20 cells). (C) Shift in whole-cell current reversal potential (Vm) by 10−5 M butaprost (n=20 cells). (D) Concentration–response curves for KCa3.1 suppression by PGE2 and the EP2 agonist butaprost (mean±SEM of five cells for each).
