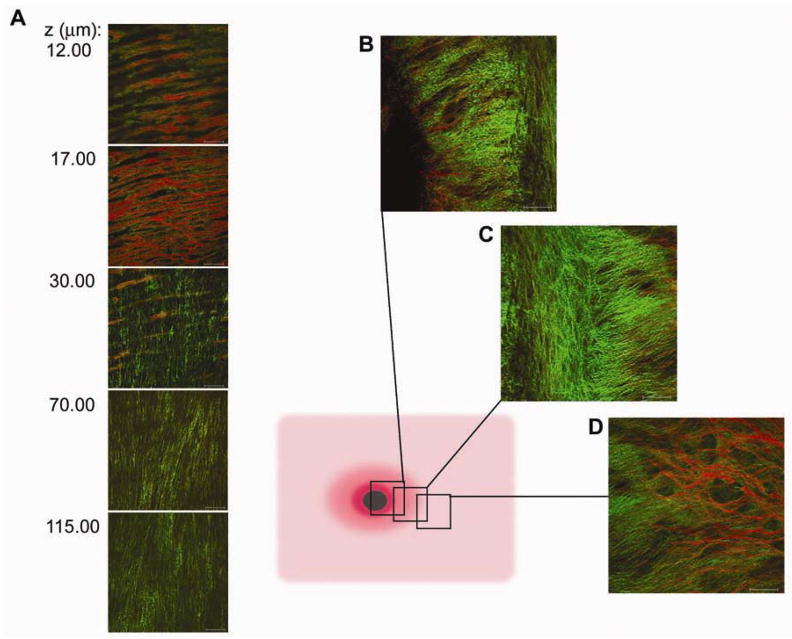
Figure 3.
Collagen and elastin microstructure of the porcine coronary artery. A, Selected two-photon z-series images from the luminal surface (12.00 μm) through to the deeper layers of the arterial media (115.00 μm). Elastin auto-fluorescence is in red and collagen SHG is in green. A net-like IEL covers the luminal surface of the coronary free wall. Diagram illustrates the areas at which images were taken along a coronary arterial branch point. B, Images were taken from the edge of the free wall. C, Densely knotted collagen structure is not covered by the IEL surrounds the ostia. D, Portion of the cut branching artery. Scale bar, 50 μm.

