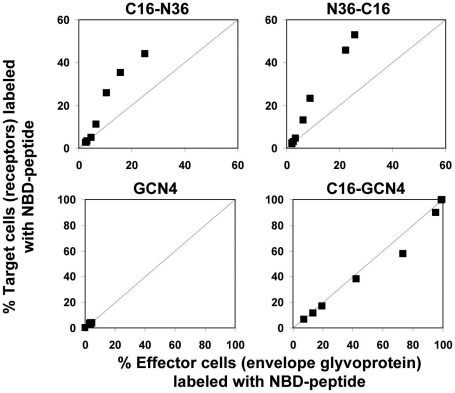
Figure 6. Relative binding of labeled peptides to the membrane of specific cell populations.
In each panel the Y axis represents the percentage of target cells (with receptors) labeled with NBD-peptide whereas the X axis represents the percentage of effector cells (with envelope glycoprotein) labeled with NBD-peptide. The lower panels illustrate two controls utilized: NBDGCN4 as a non-binding peptide and C16-NBDGCN4 as a strongly non-specific binding peptide. A line is drawn in each panel to emphasize where we would expect the data in case there is no preference between the different populations. The different data points represent rising peptide concentrations.

