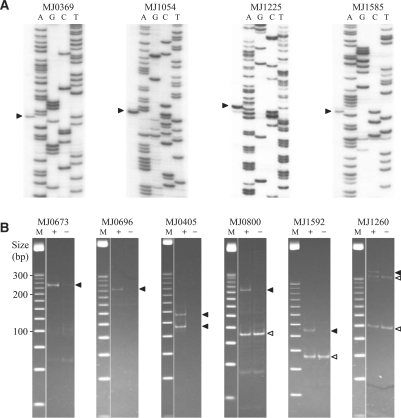
Figure 1.
Mapping TSSs using primer extension and 5′-RACE. (A) Examples of primer extension. Arrowheads indicate runoff transcripts. (B) Examples of 5′-RACE. Each panel is a nondenaturing polyacrylamide gel photographed using Chemi Doc™ System (Bio-Rad). Lanes: M, 25 bp DNA ladder (Promega); +, RT–PCR products from TAP-treated RNA; –, RT–PCR products from untreated RNA (control). Solid arrowheads indicate TSSs. Open arrowheads indicate processing sites.

