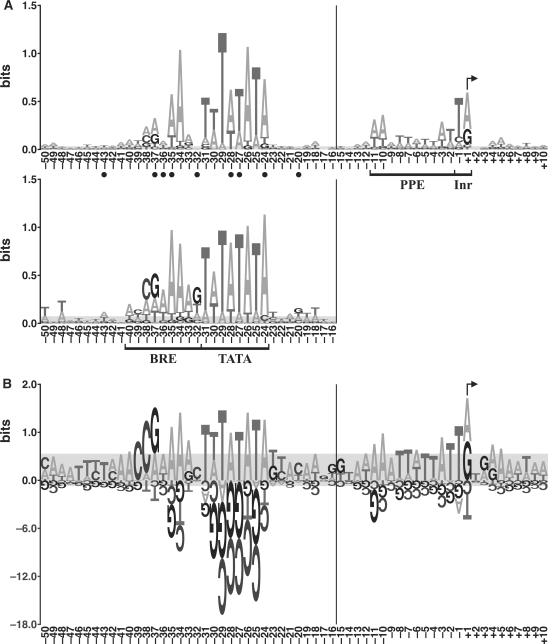
Figure 3.
Logos of promoter sequences. (A) Energy-normalized sequence logos of the protein promoters in this study (top) and the promoters previously identified by the in vitro selection (bottom) (18). The horizontal axis shows nucleotide positions, and the vertical axis is information content in bits (see Materials and Methods section). Promoter elements (BRE, TATA box, PPE and Inr) are bracketed, and the TSS is indicated with a bent arrow. Of the protein promoters in this study, the total information content of BRE is 2.63 bits, TATA box 6.09 bits, PPE 1.84 bits and Inr 1.13 bits. Of the in vitro selected promoters, the total information content of BRE is 4.28 bits, and TATA box 7.05 bits. Closed circles indicate positions at which the protein promoters differ significantly from the in vitro selected promoters (P < 0.05, data from Supplementary Table S3). (B) PWM logo of the protein promoters in this study. The values on the vertical axis are bit scores (which are distinct from bits of information, see Materials and methods section). The vertical scale below the axis is reduced 6-fold relative to that above. Due to the variation in spacing between the TATA box and the TSS, the nucleotide position numbers to the left of the vertical bars in panels A and B are for the most common spacing. In both panels, the gray areas would completely cover 90% of the logos generated from random sets of nucleotides drawn from the genomic base composition, and sample size matched to the number of sequences in the particular logo (i.e. it is a measure of the random background).

